Burndown charts are essential tools for tracking the progress of Agile projects, visually displaying the remaining work versus time within a sprint or iteration. In QPunch, these charts provide insights into how much work remains and how efficiently the project team is completing tasks. This guide will walk you through how to create and use burndown charts to track story points for your Agile project.
Making Your Project Agile:
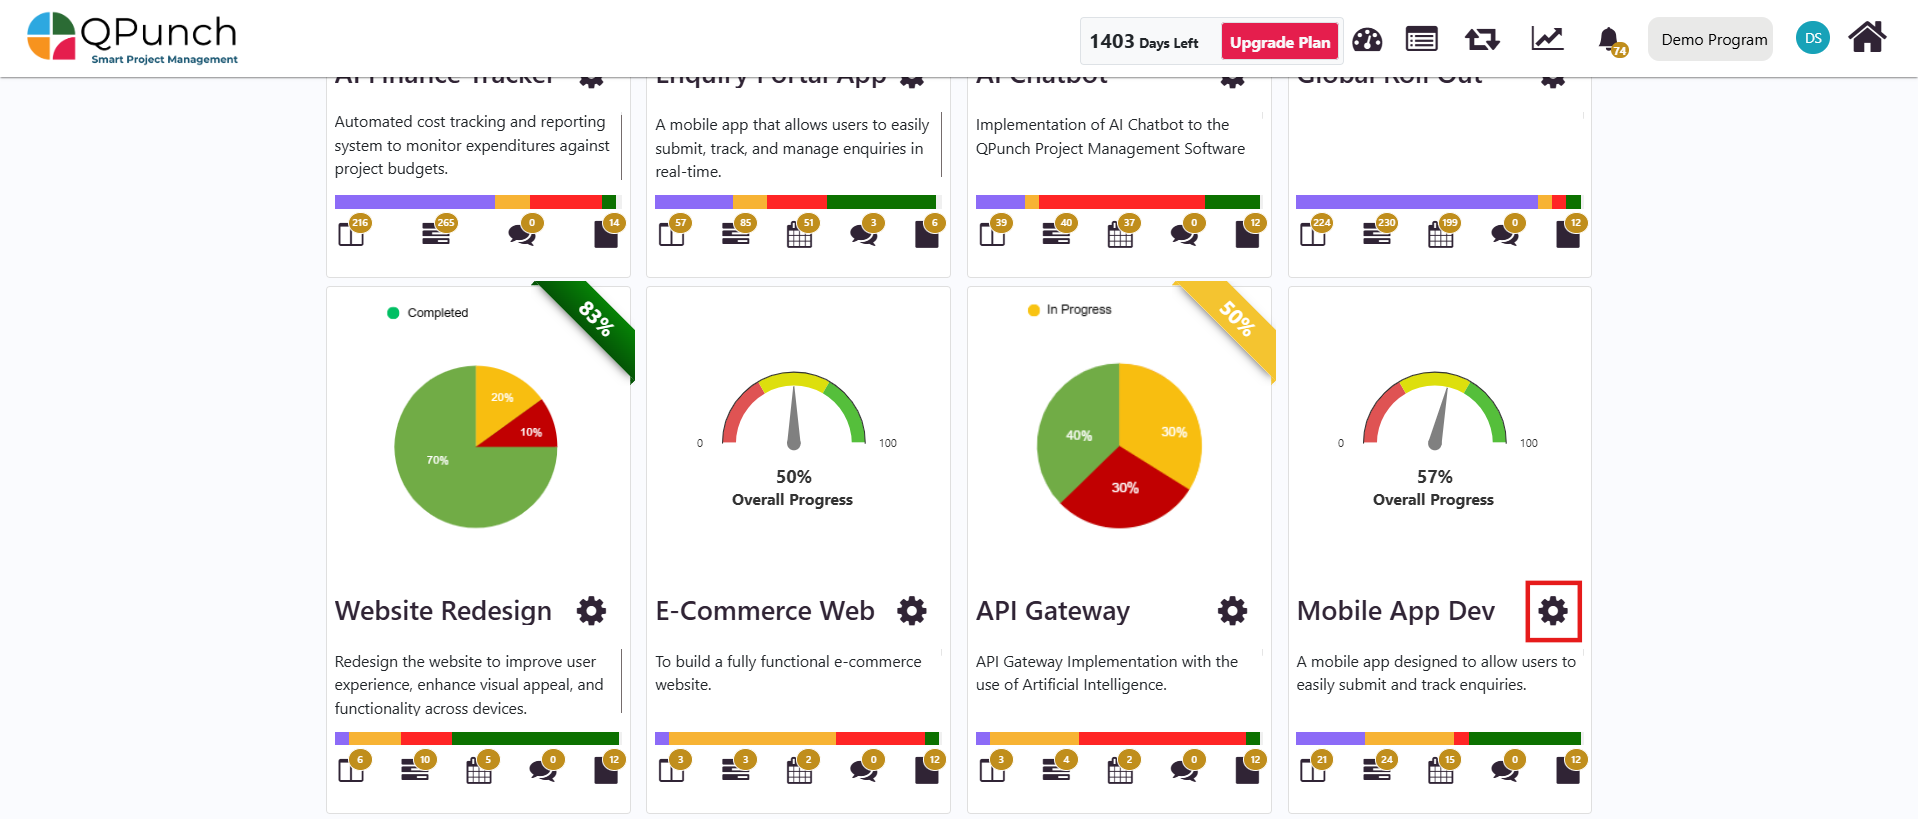
To enable the Agile features in your project and start using burndown charts, follow these steps:
Navigate to Project Settings from Home page.
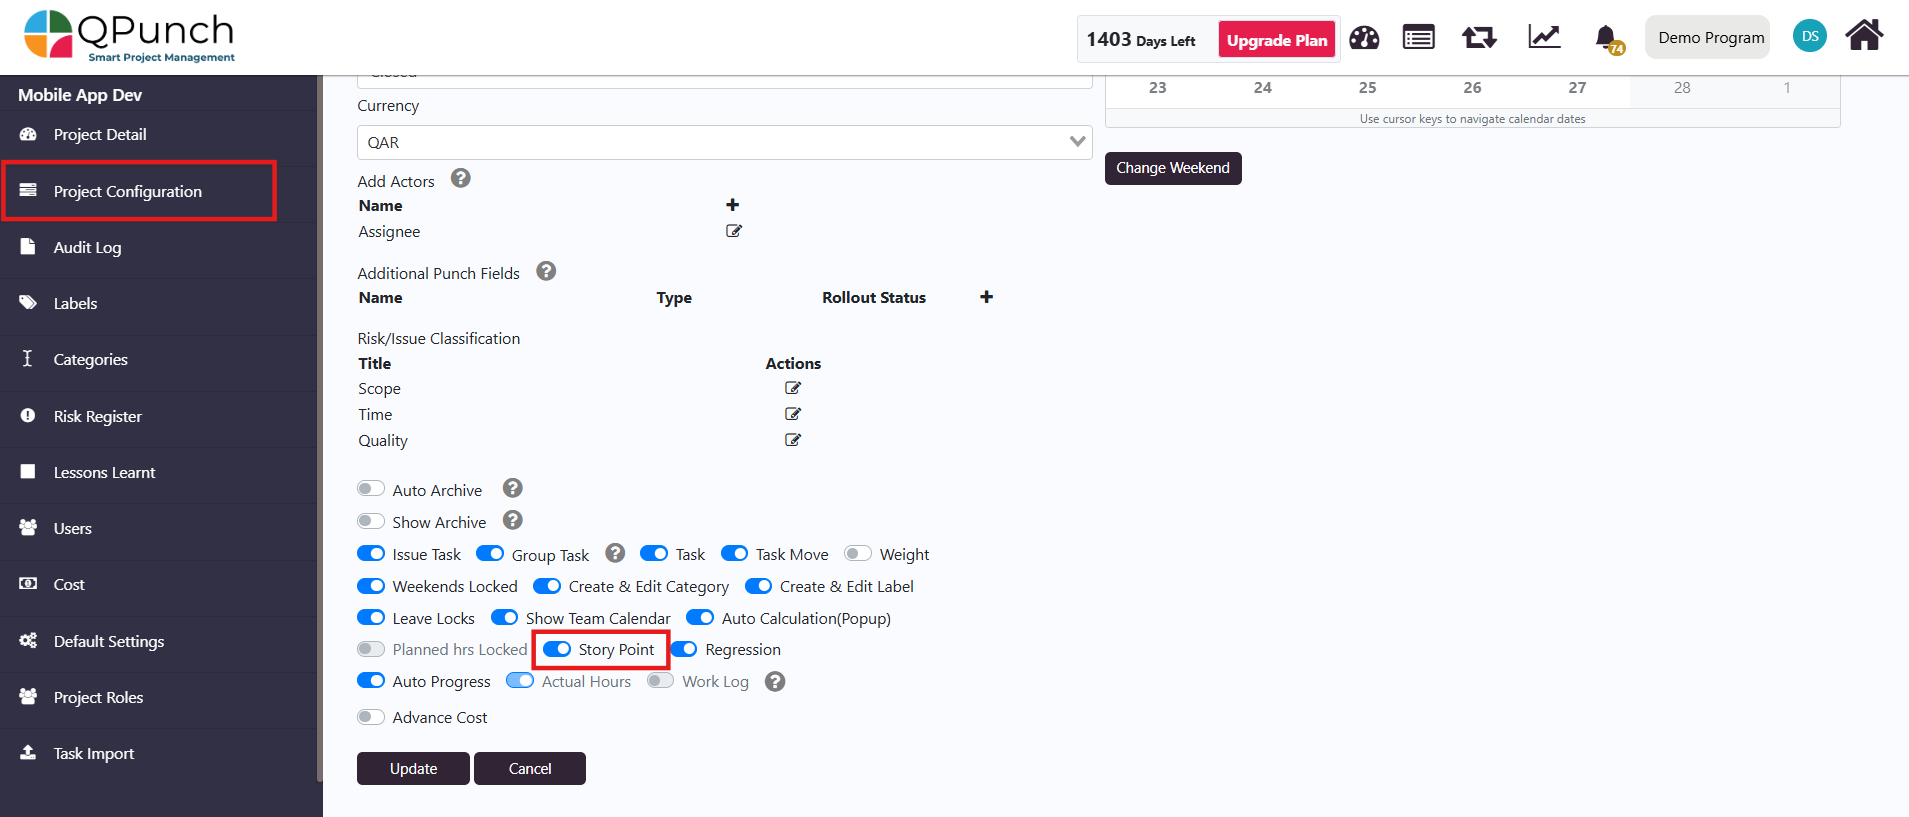
2. Go to Project Configurationandenable Story Points by toggling the setting to “On”.
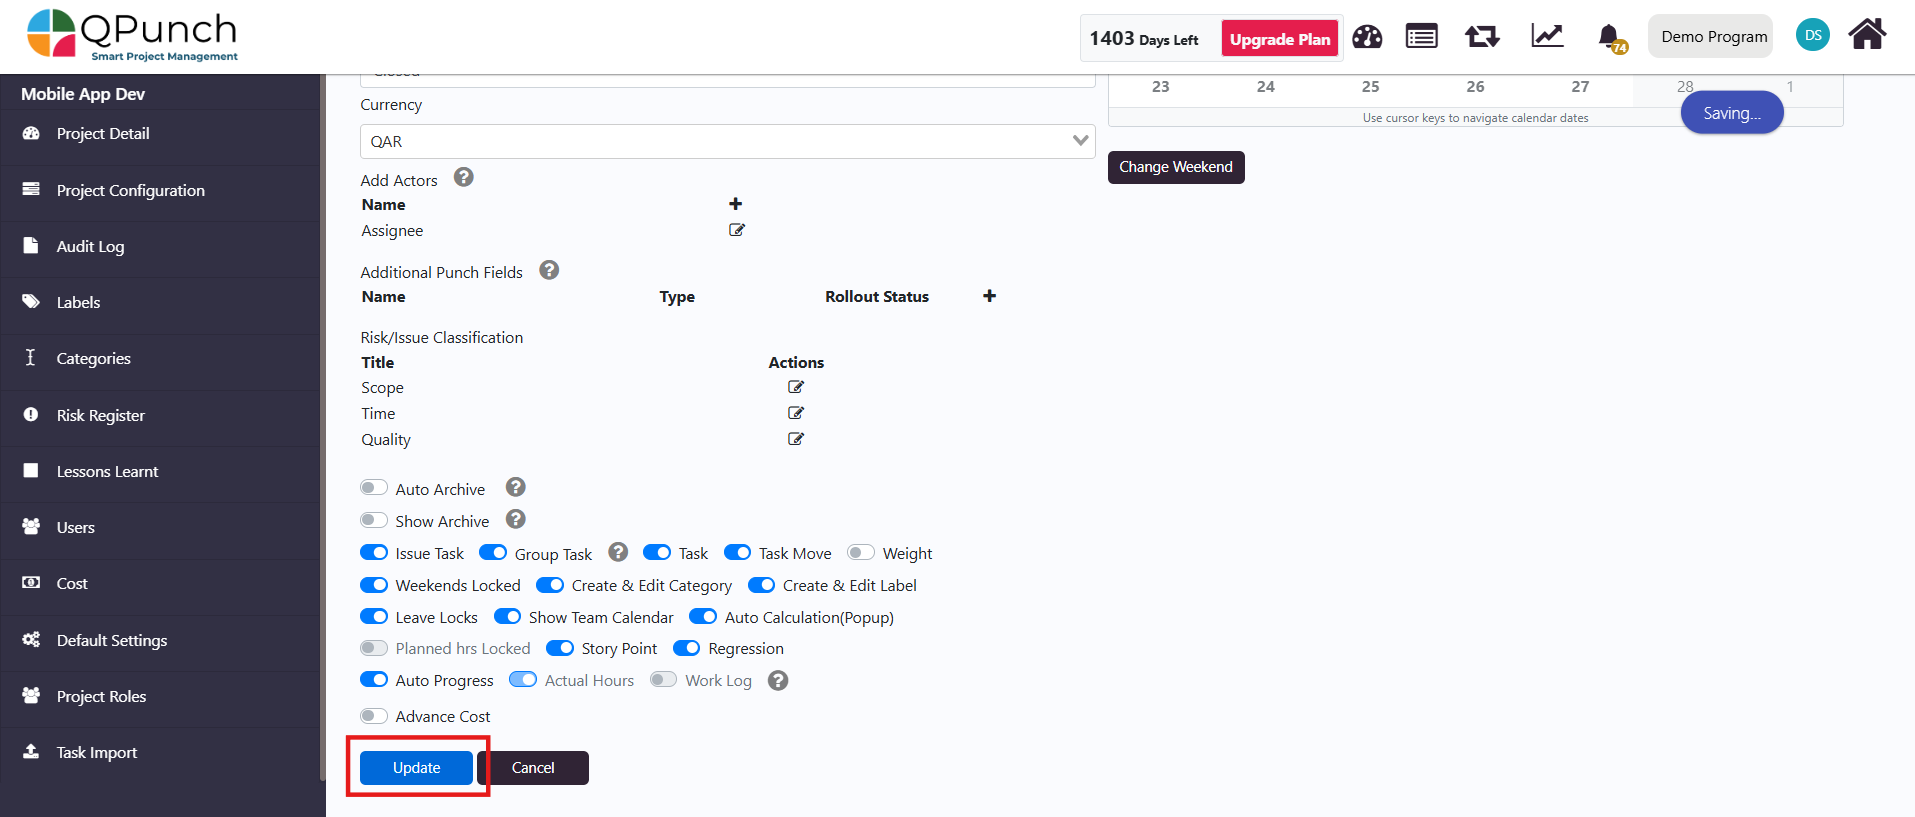
3. Click Update to save your changes.
Setting Up Tasks with Story Points:
Once the project is made Agile by enabling Story Points, you can begin assigning story points to tasks:
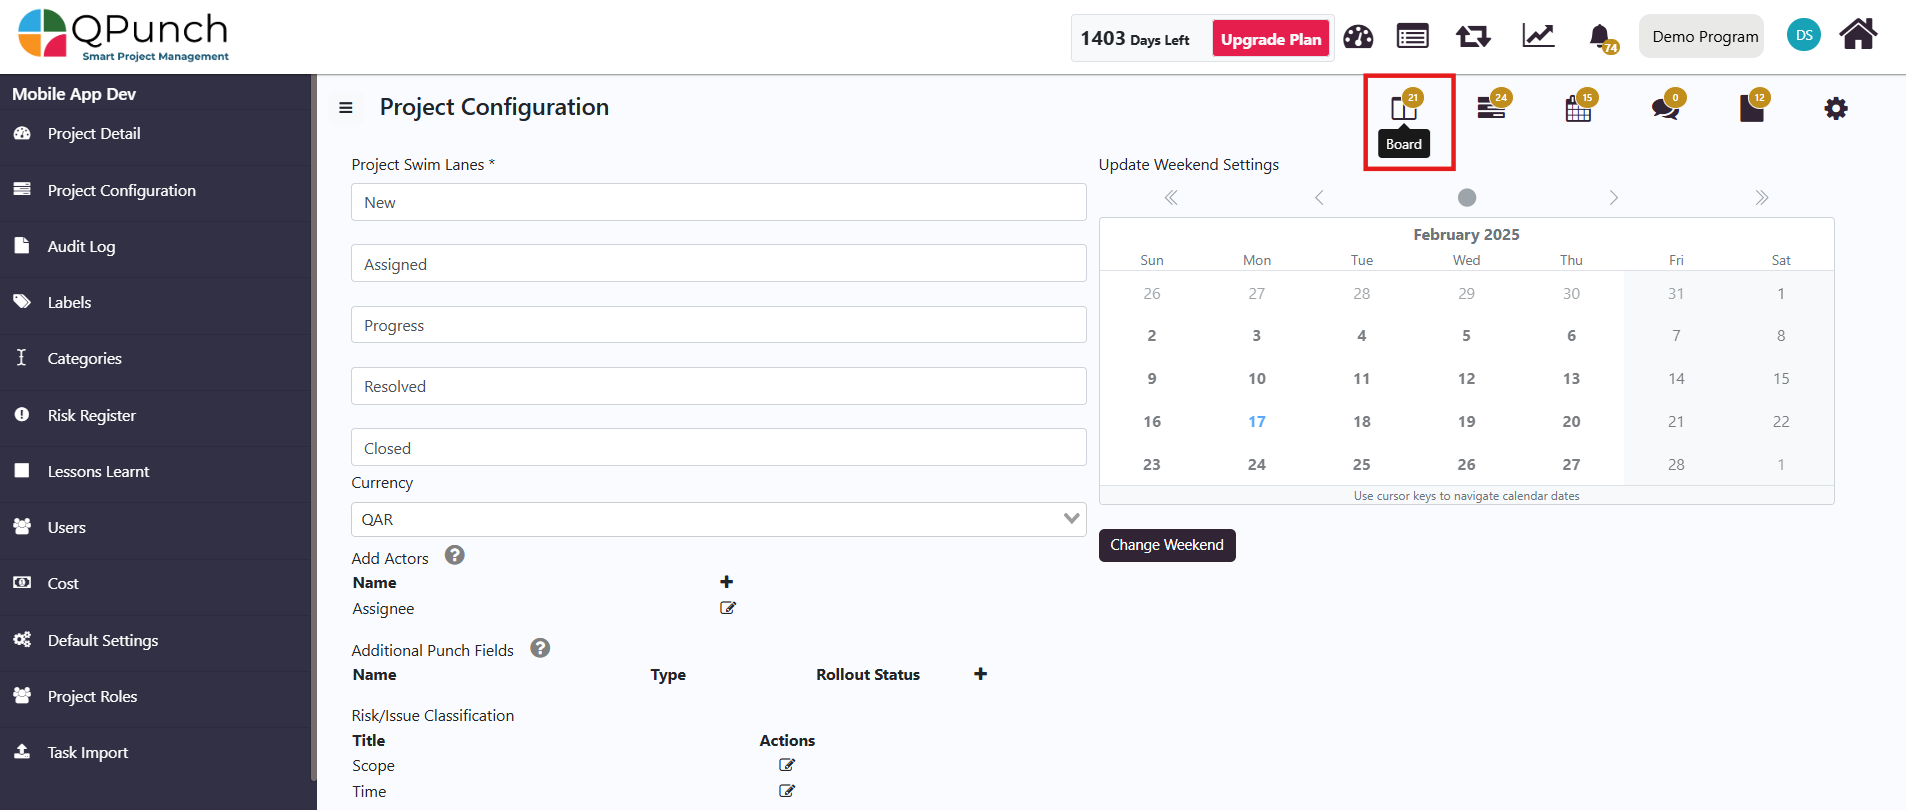
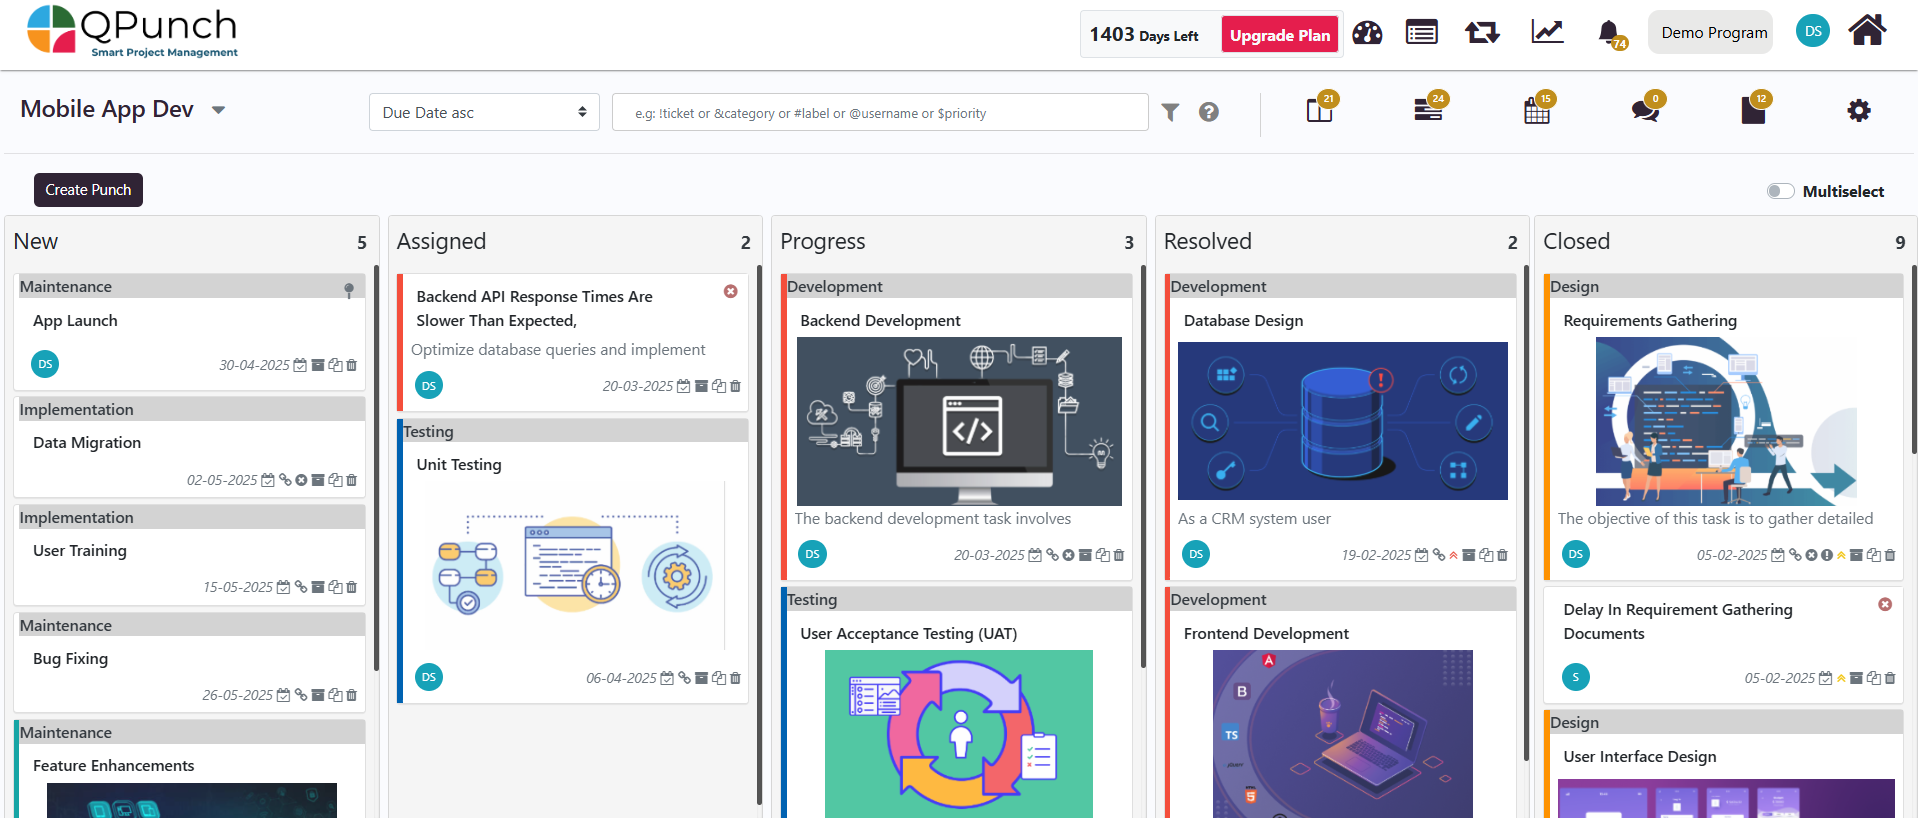
Navigate to the Kanban Board.
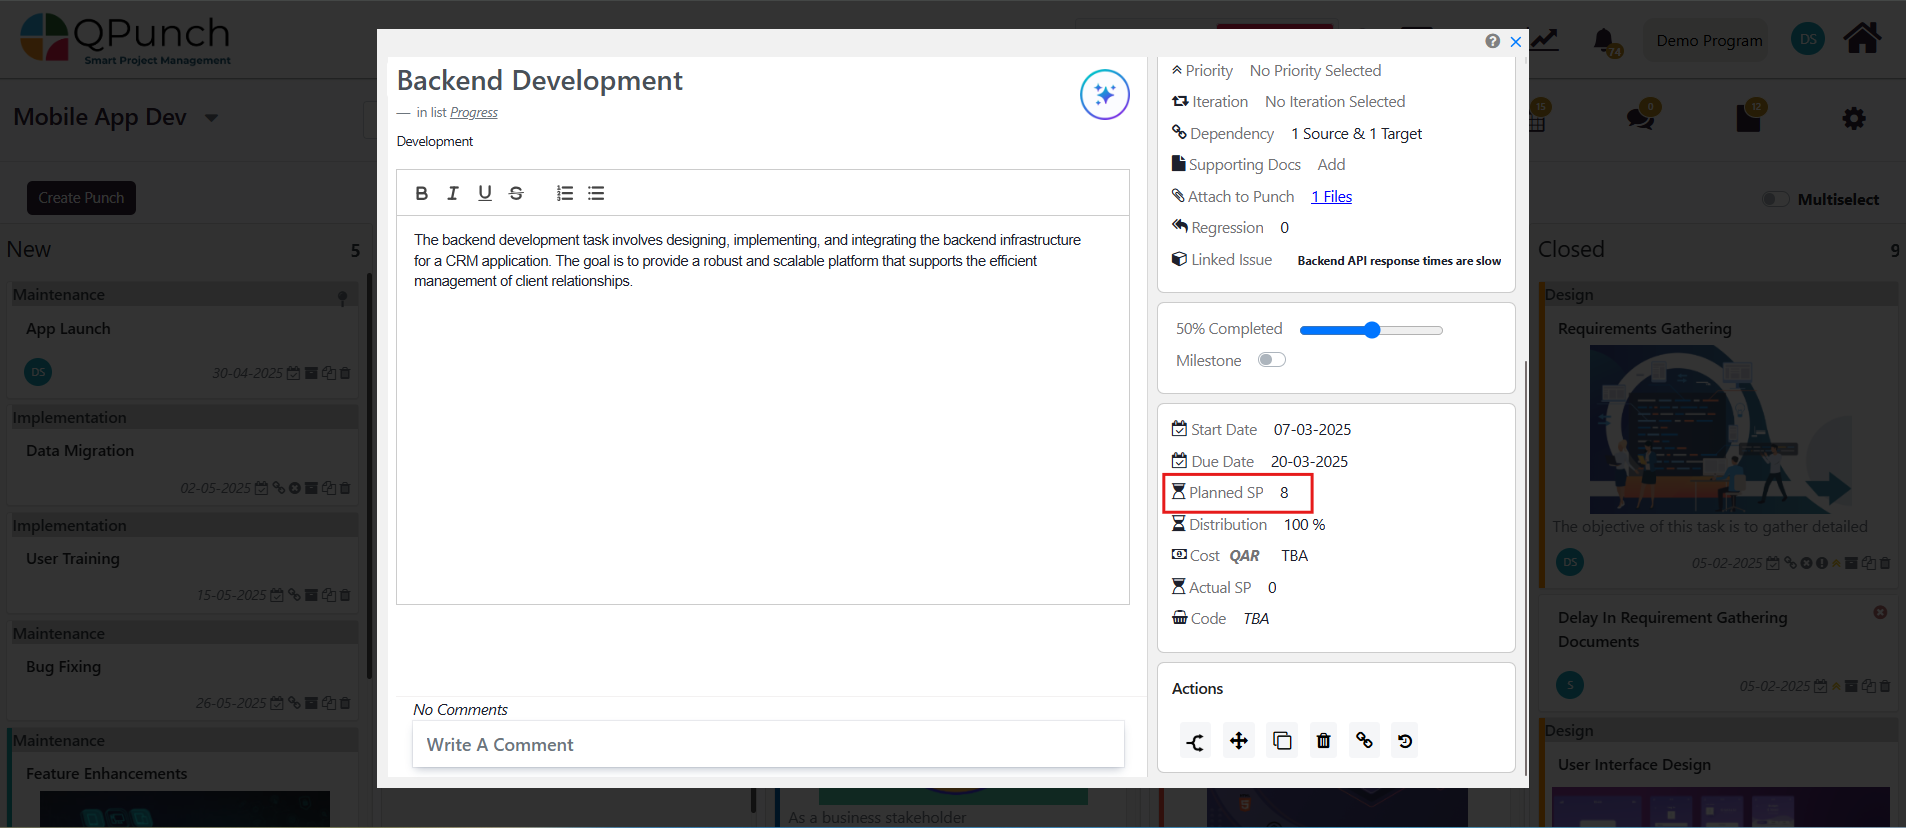
2. Click on any task to open it.
3. Set the Planned SP (Story Points) in the task details.
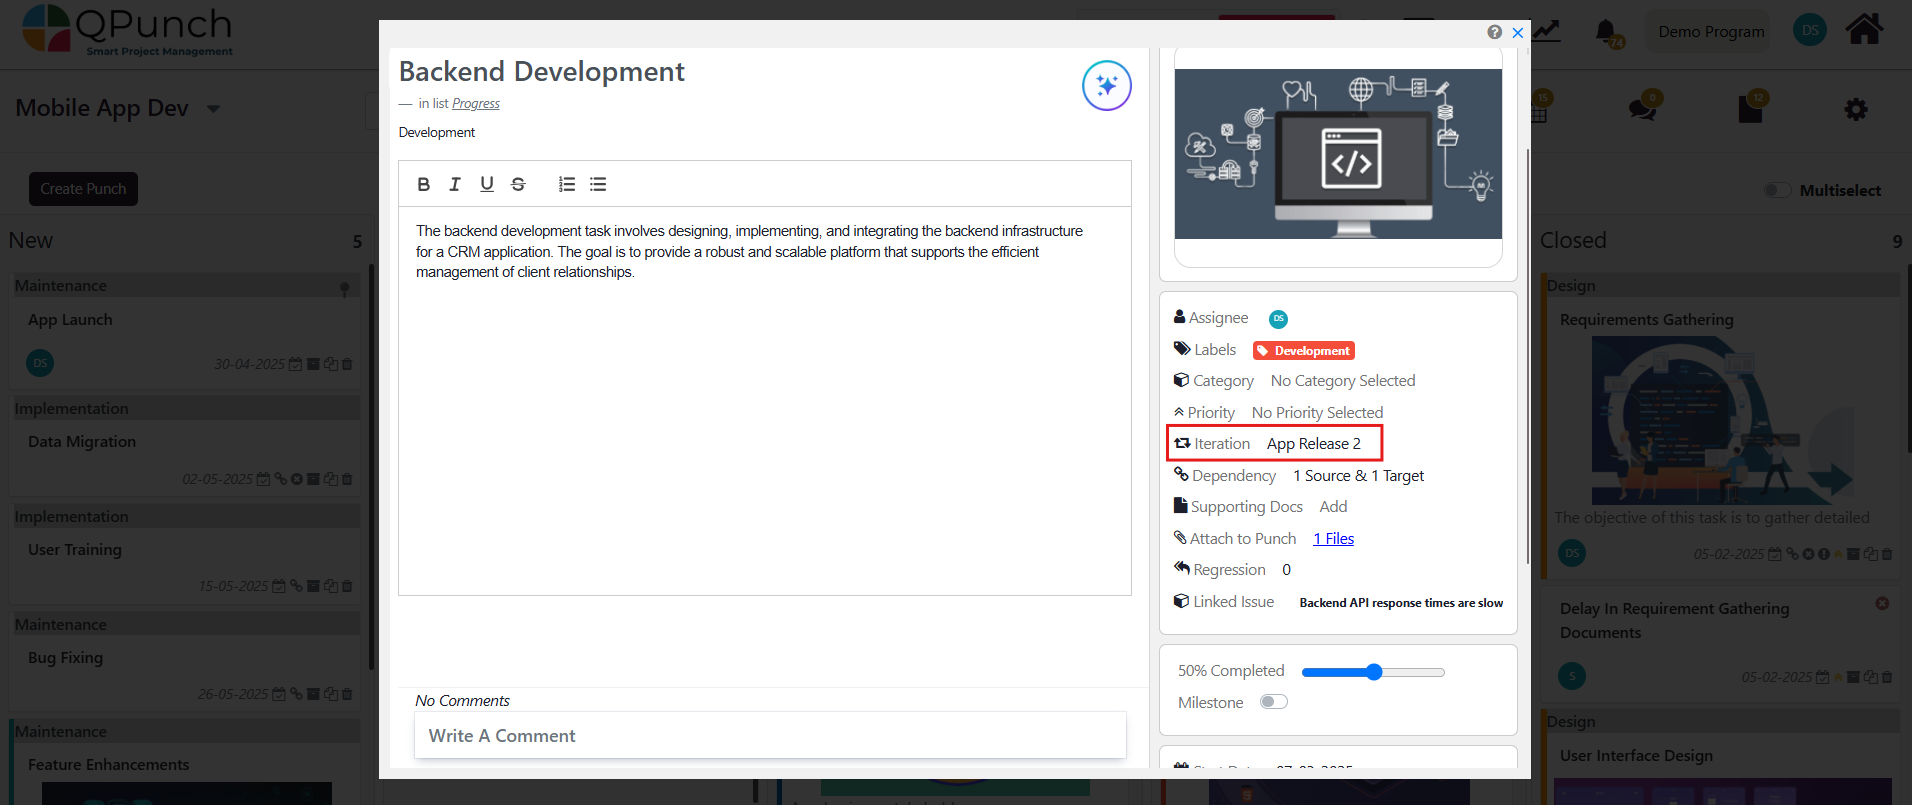
4. Optionally, you can also set the Iteration for the task by updating the Iteration field.
Managing Iterations:
To create and manage iterations for your project:
Navigate to the Iterations view.
2.Create a new iteration by following the instructions in the Iterations help file.
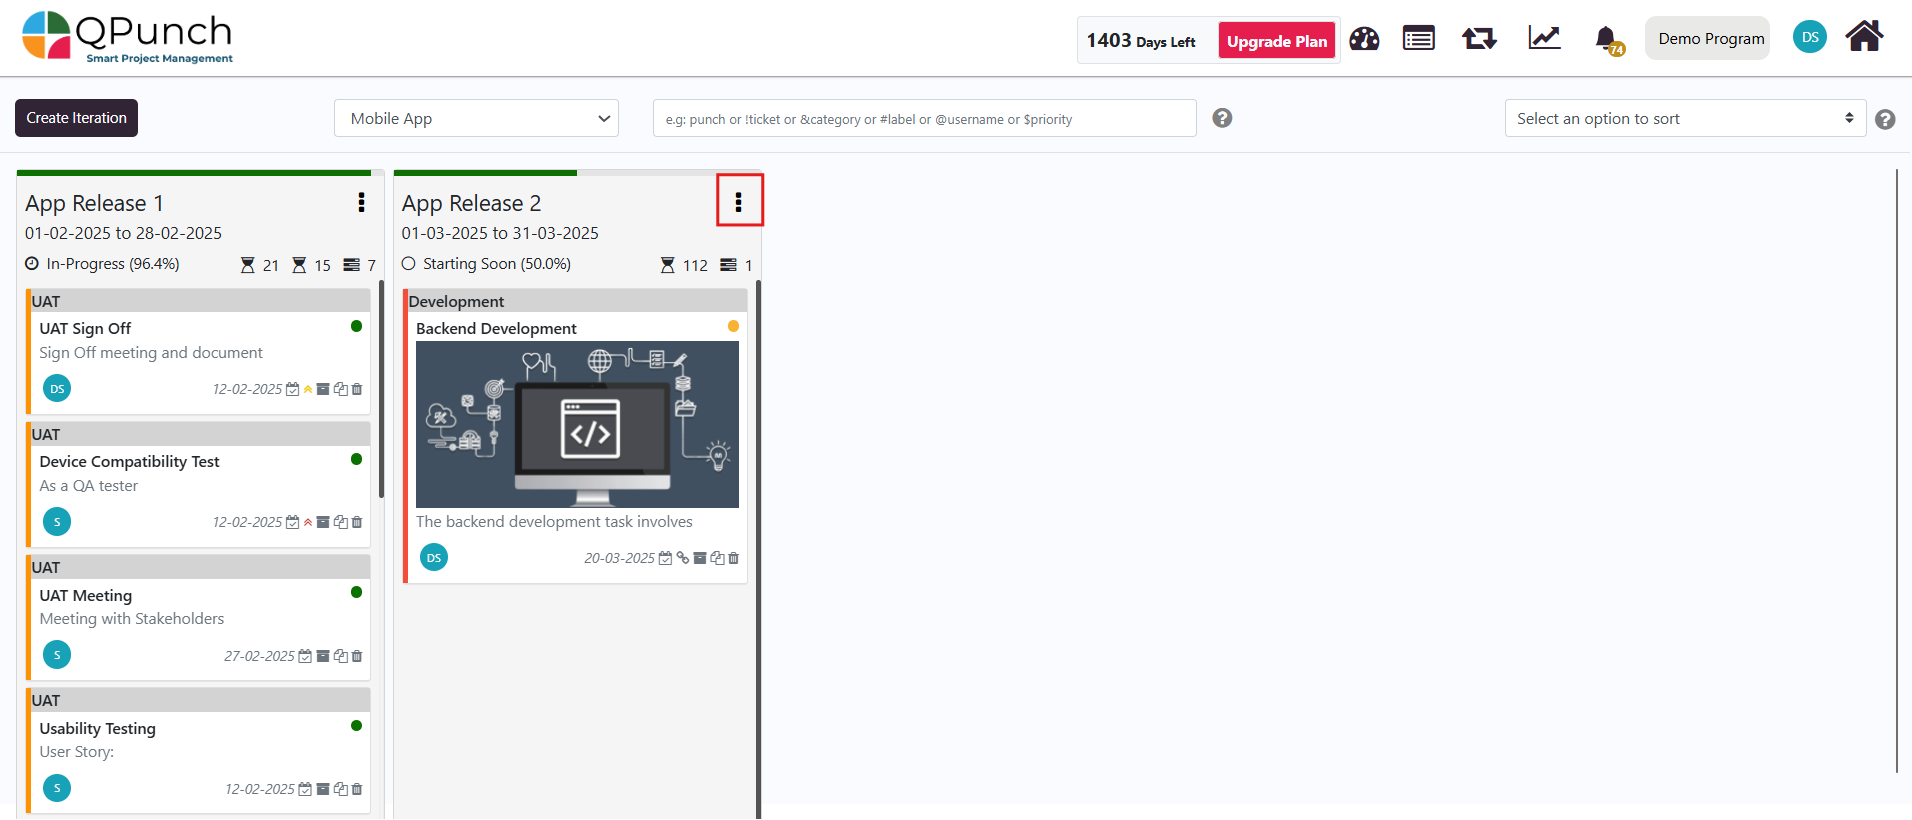
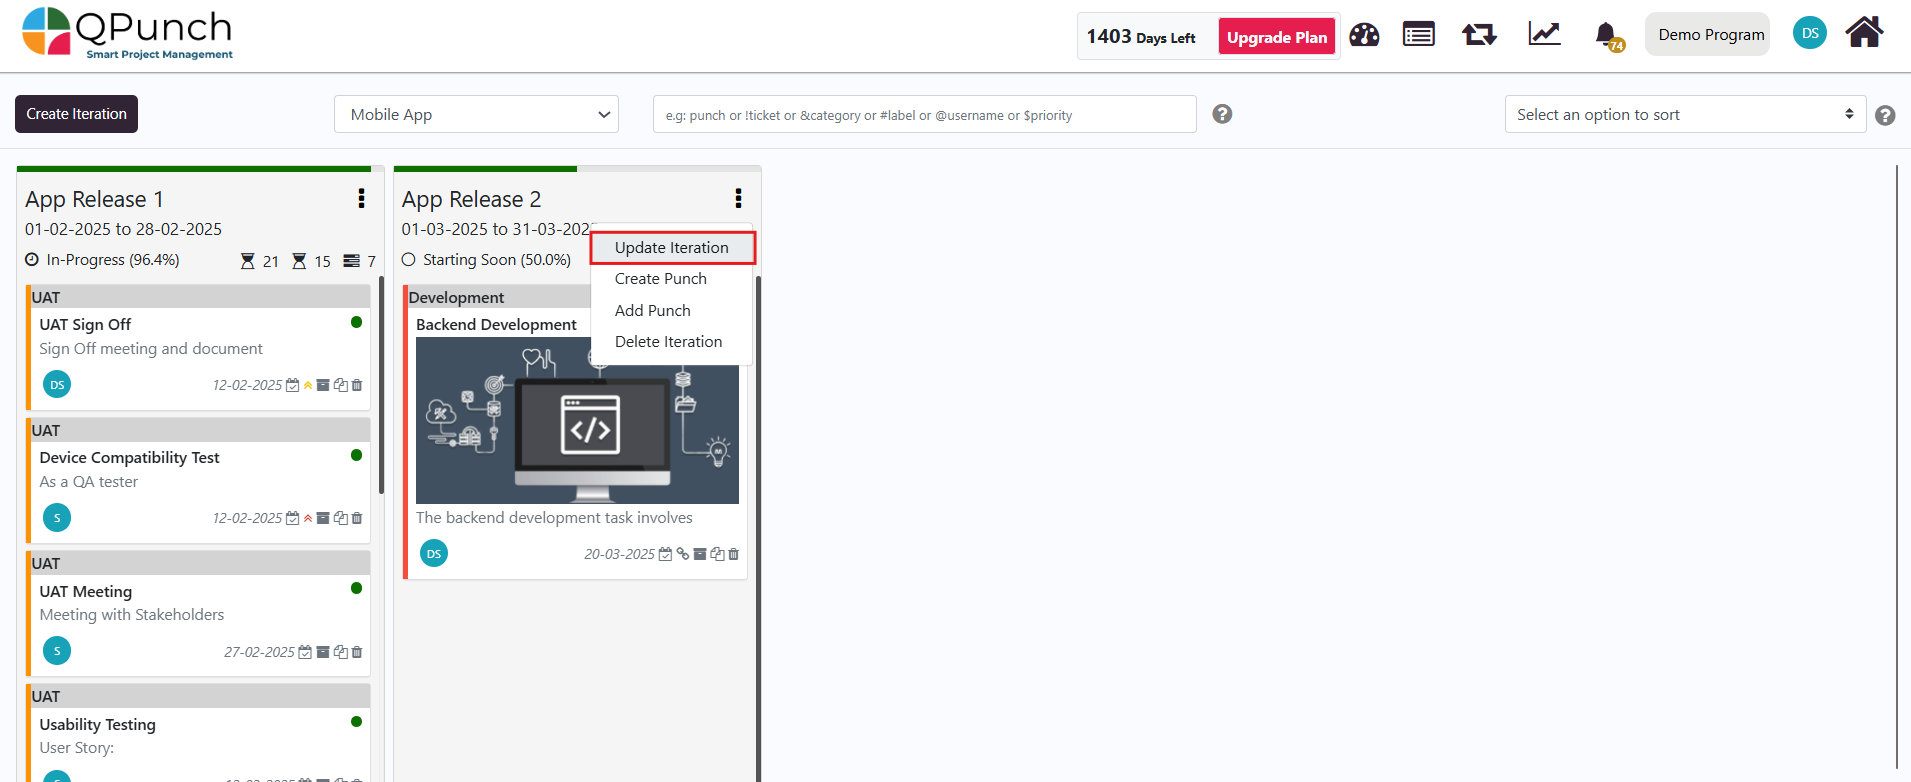
3. Once the iteration is created, click on the three dots next to it.
4. Select Update Iteration.
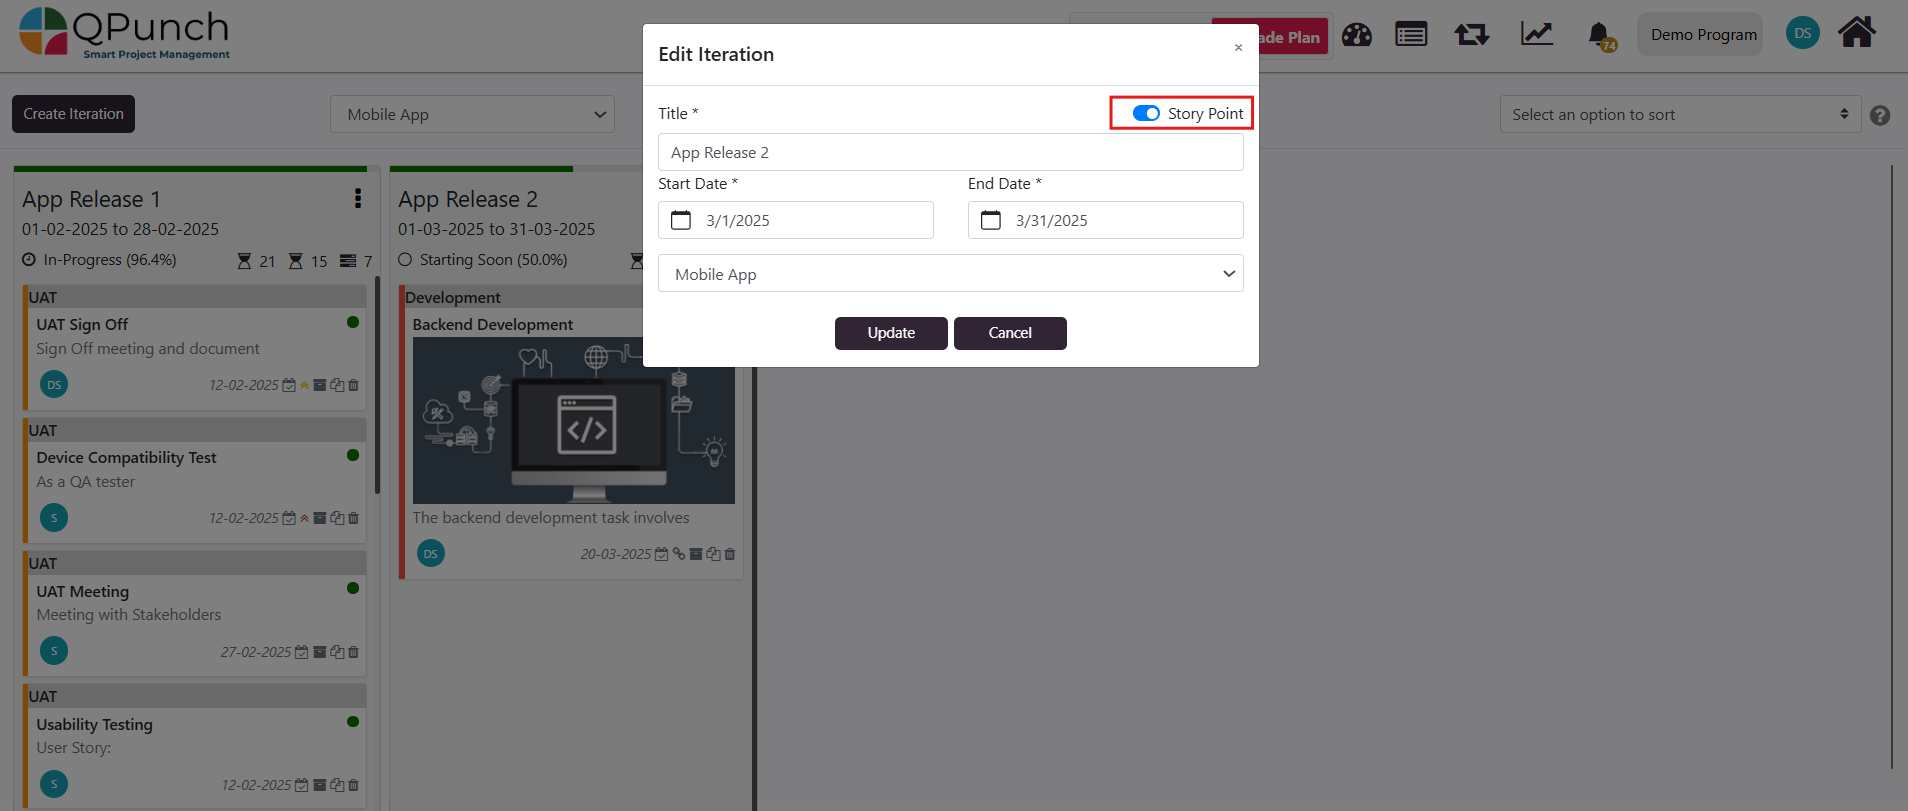
5. In the update view, enable the Story Point toggle to allow for story points within the iteration.
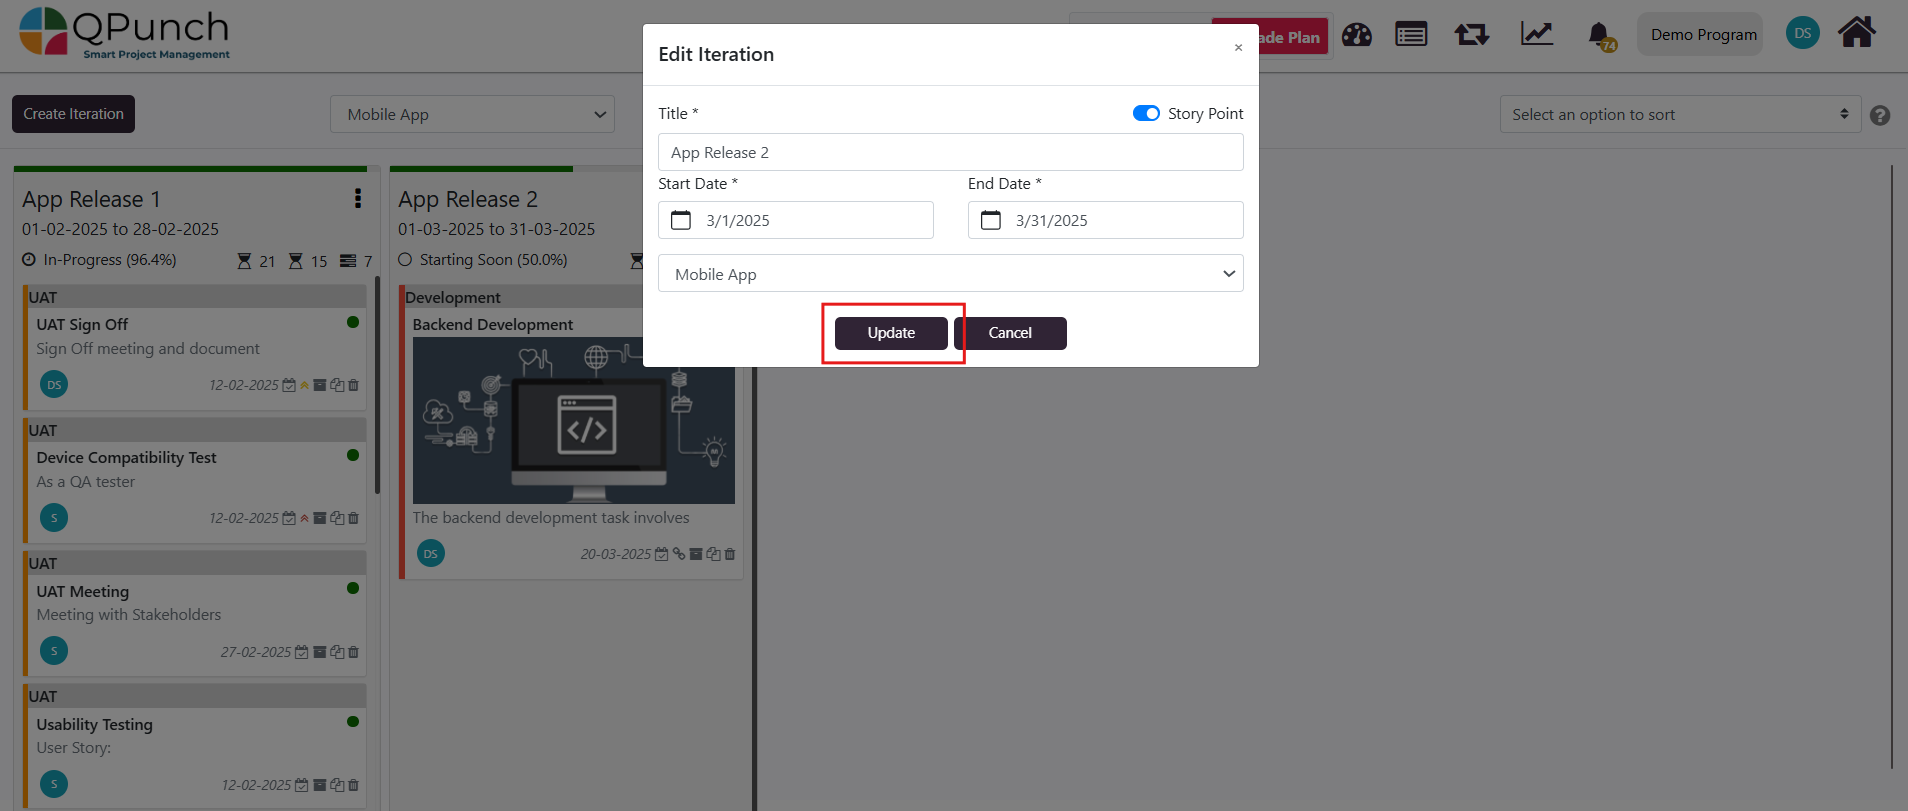
6. Click Update to save your iteration settings.
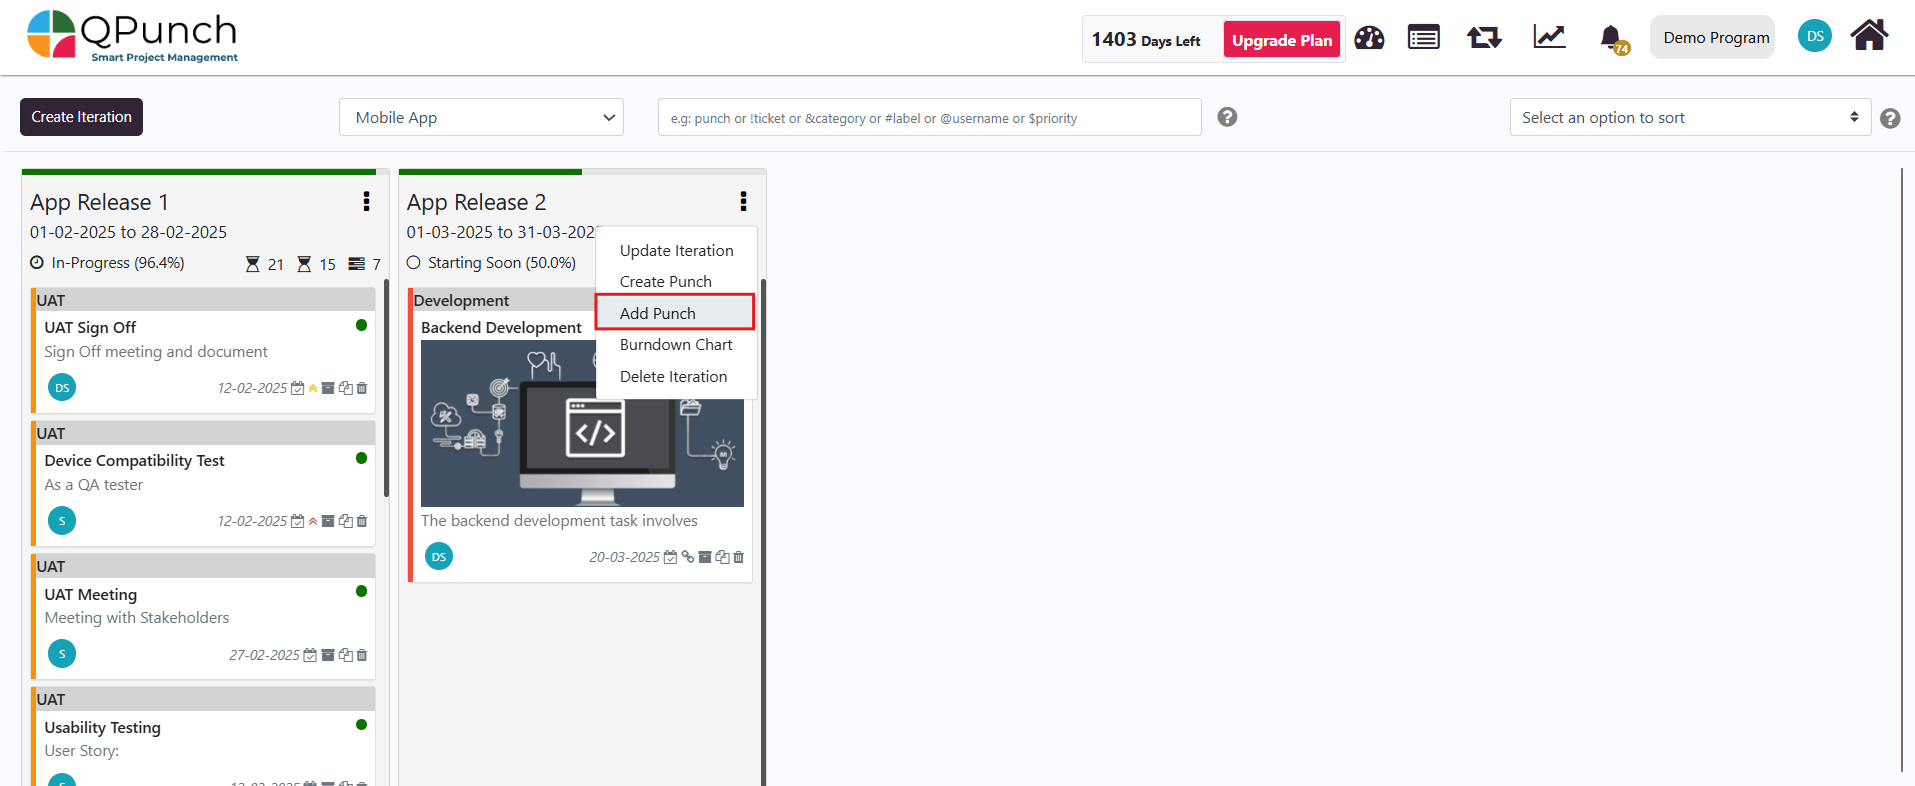
Adding Punches to the Iteration:
From the Iterations view, you can directly add punches to the iteration or create new punches for better task tracking:
Click on the three dots next to the iteration name.
Select Add Punches to add existing punches to the iteration.
3.Choose the Project, then click Select Punches.From the Punch List, tick the punches you wish to add to the iteration and click the Add button to add to the iteration.
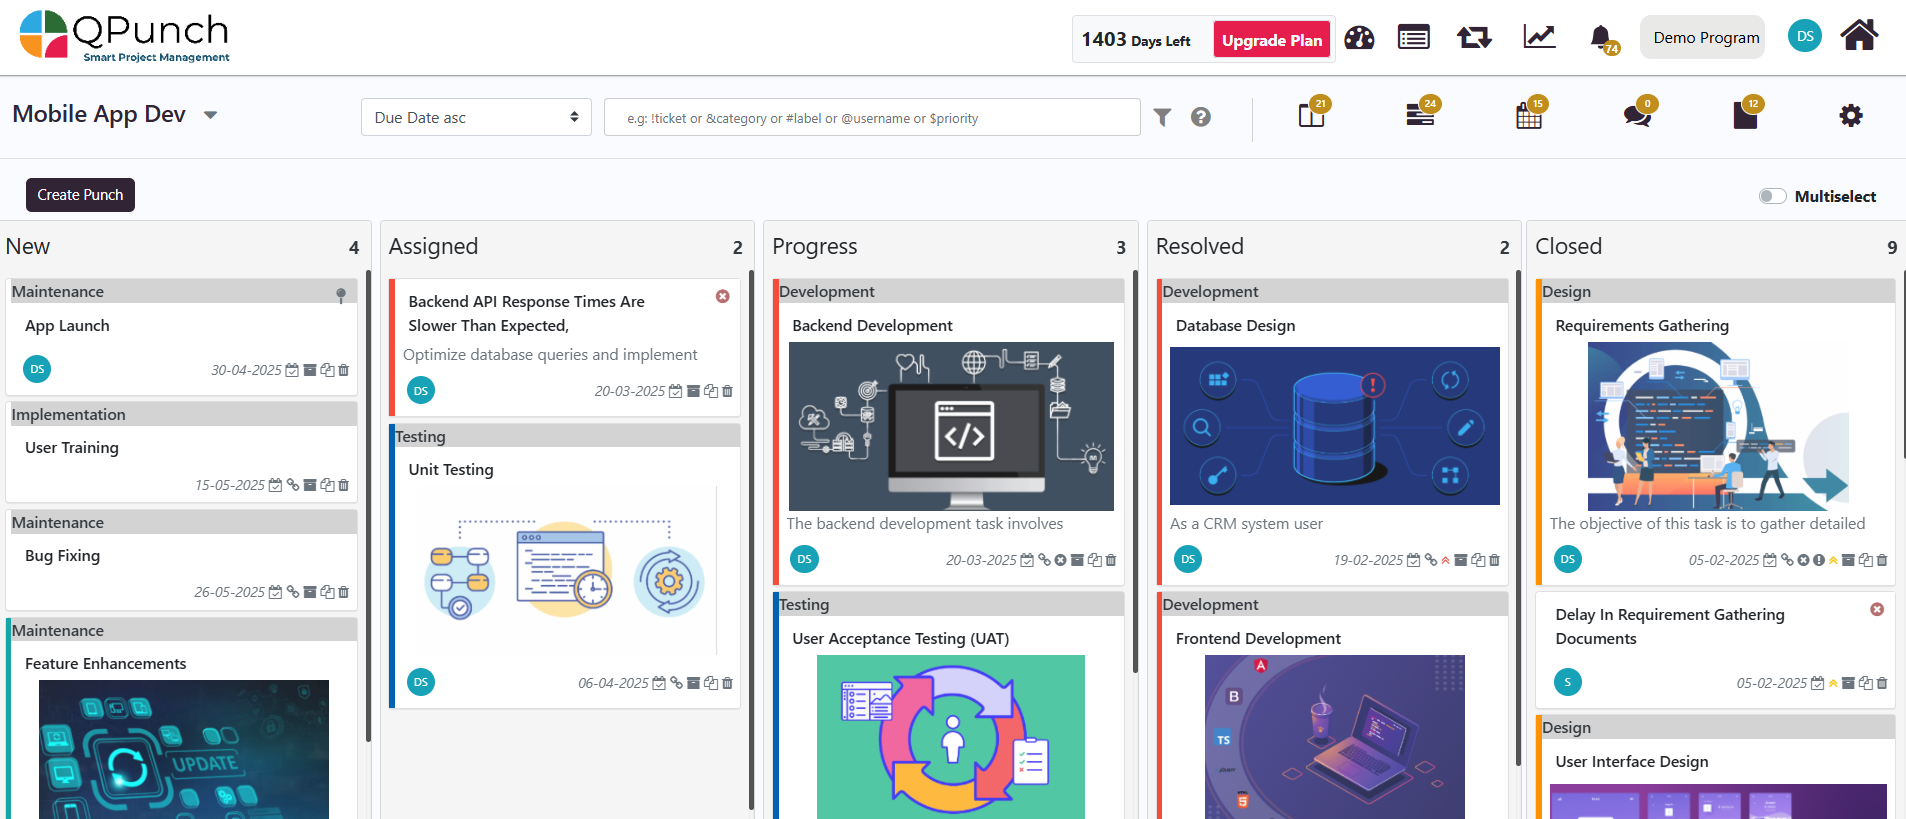
Managing Tasks in the Iteration:
Once your iterations are set, follow these steps to manage tasks within each iteration:
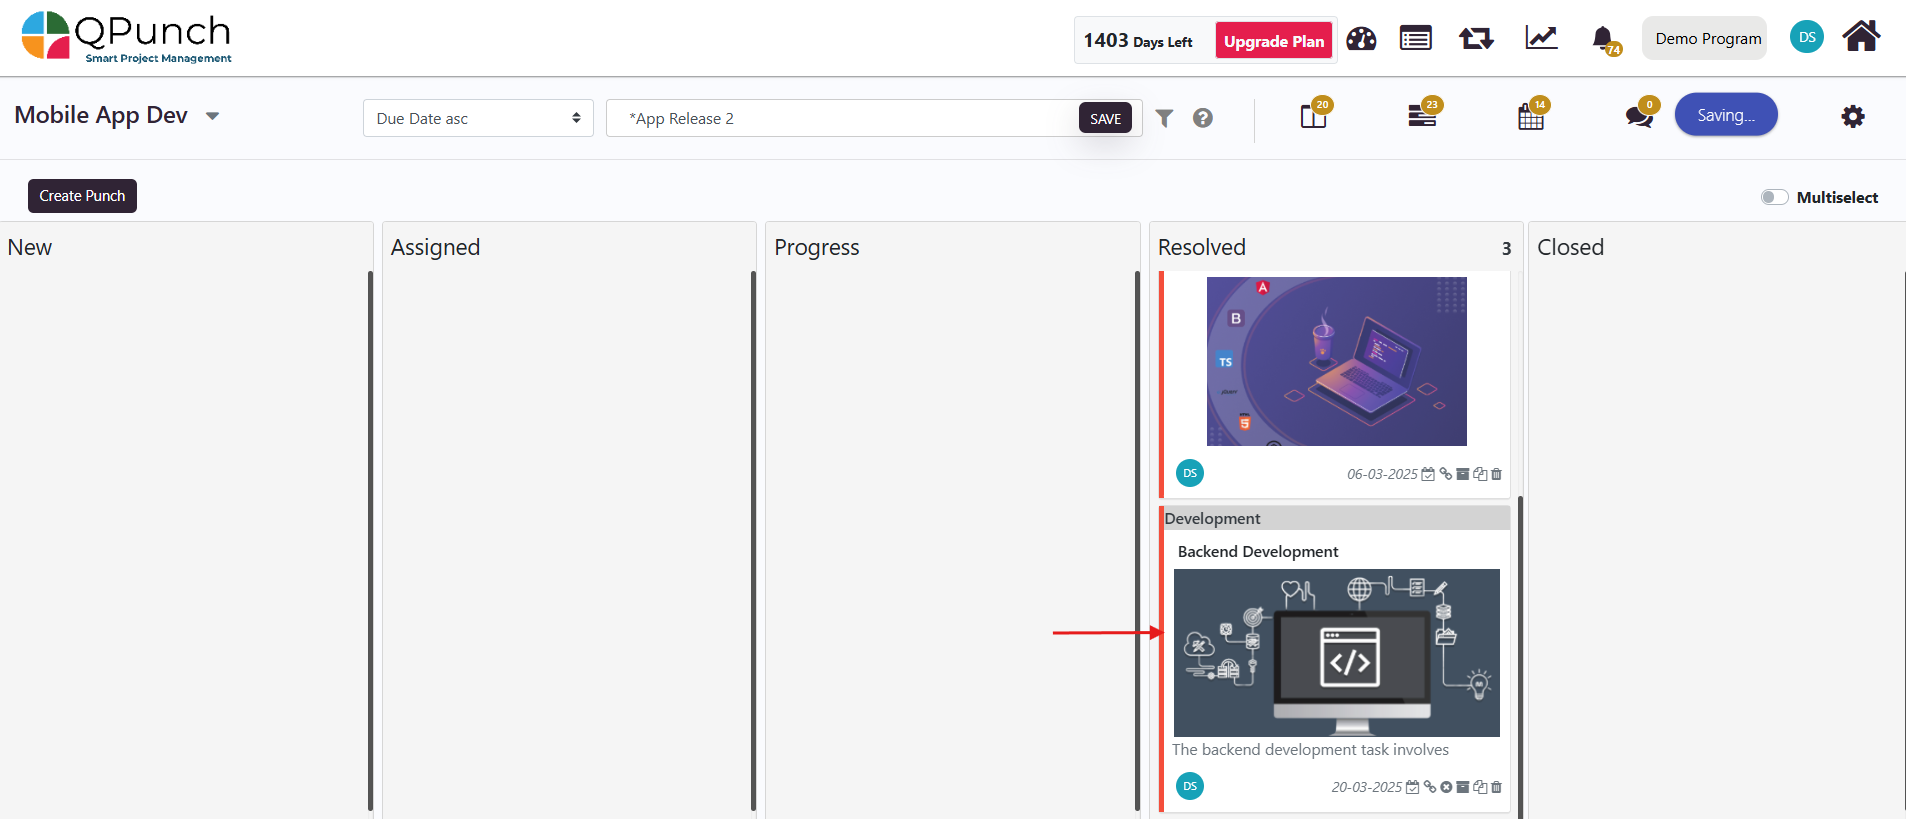
Go back to the Kanban Board.
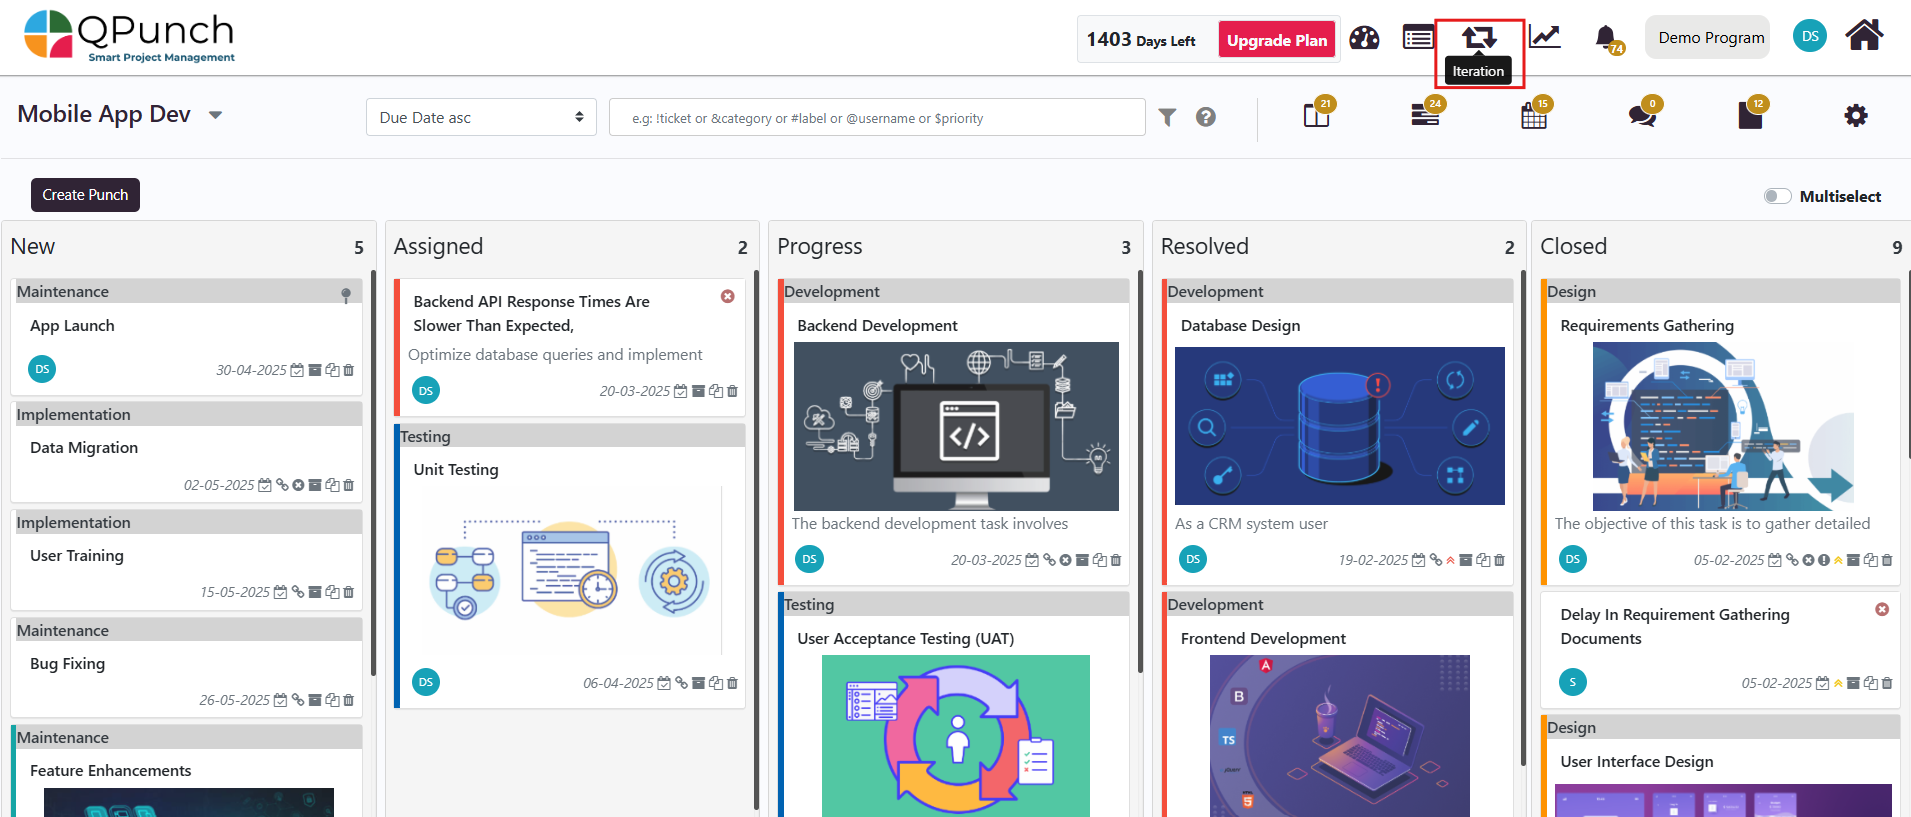
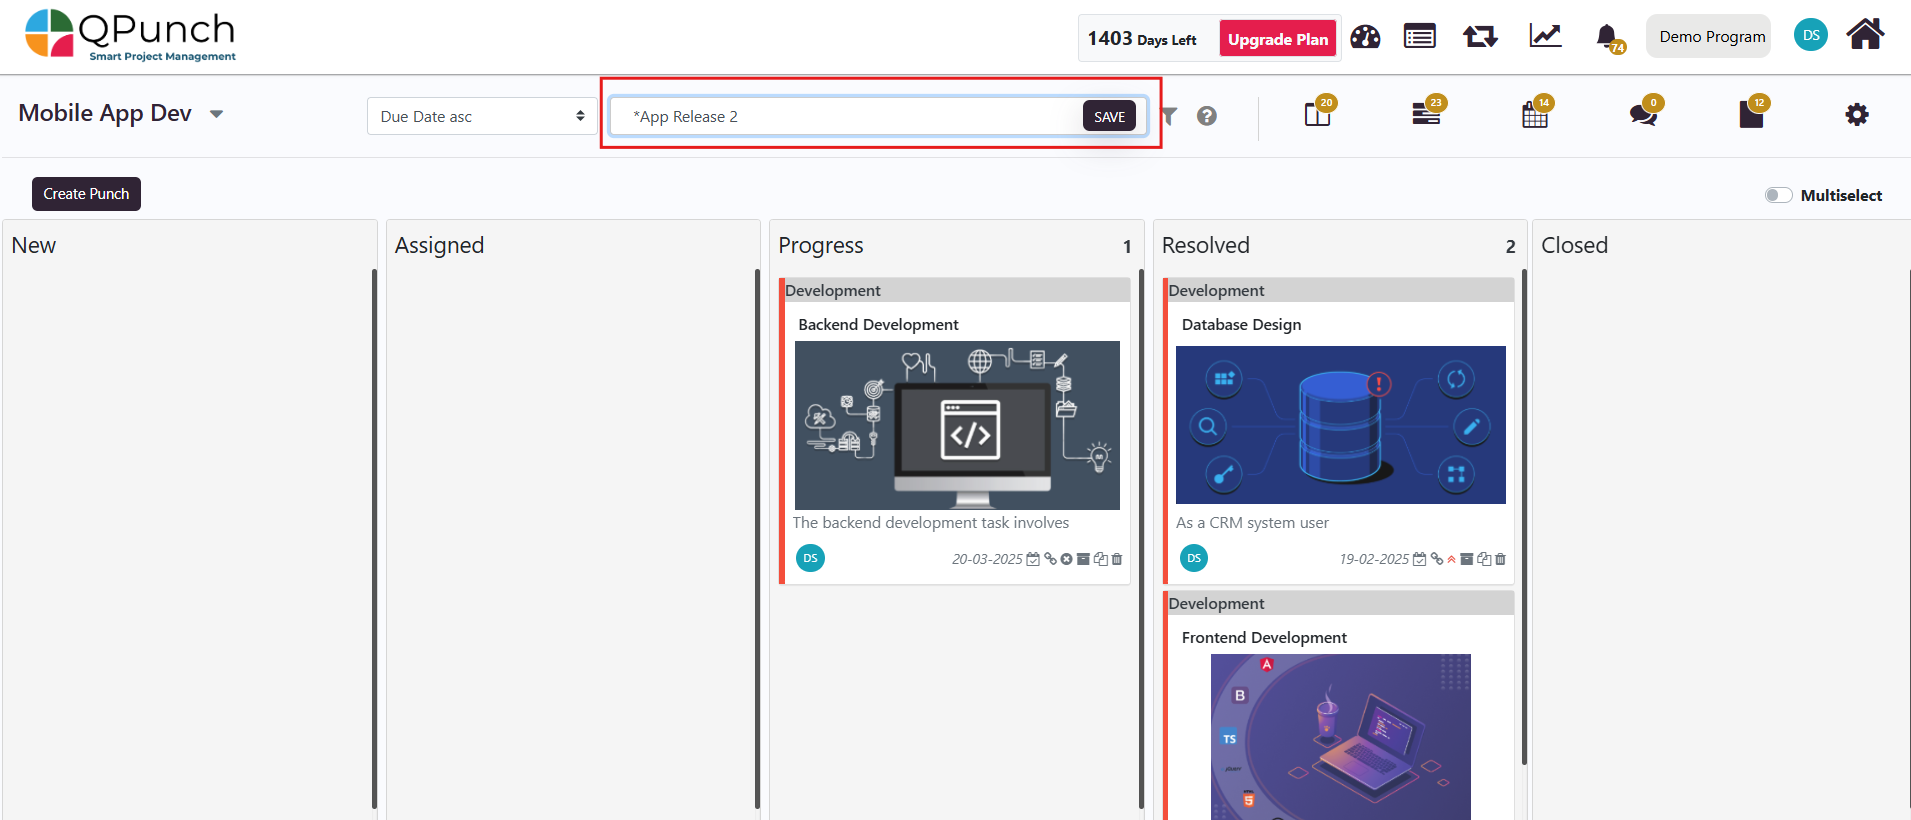
2. You can filter by the iteration to view only the relevant tasks by using the asterisk symbol (*) followed by the iteration name, for example, *App Release 2.
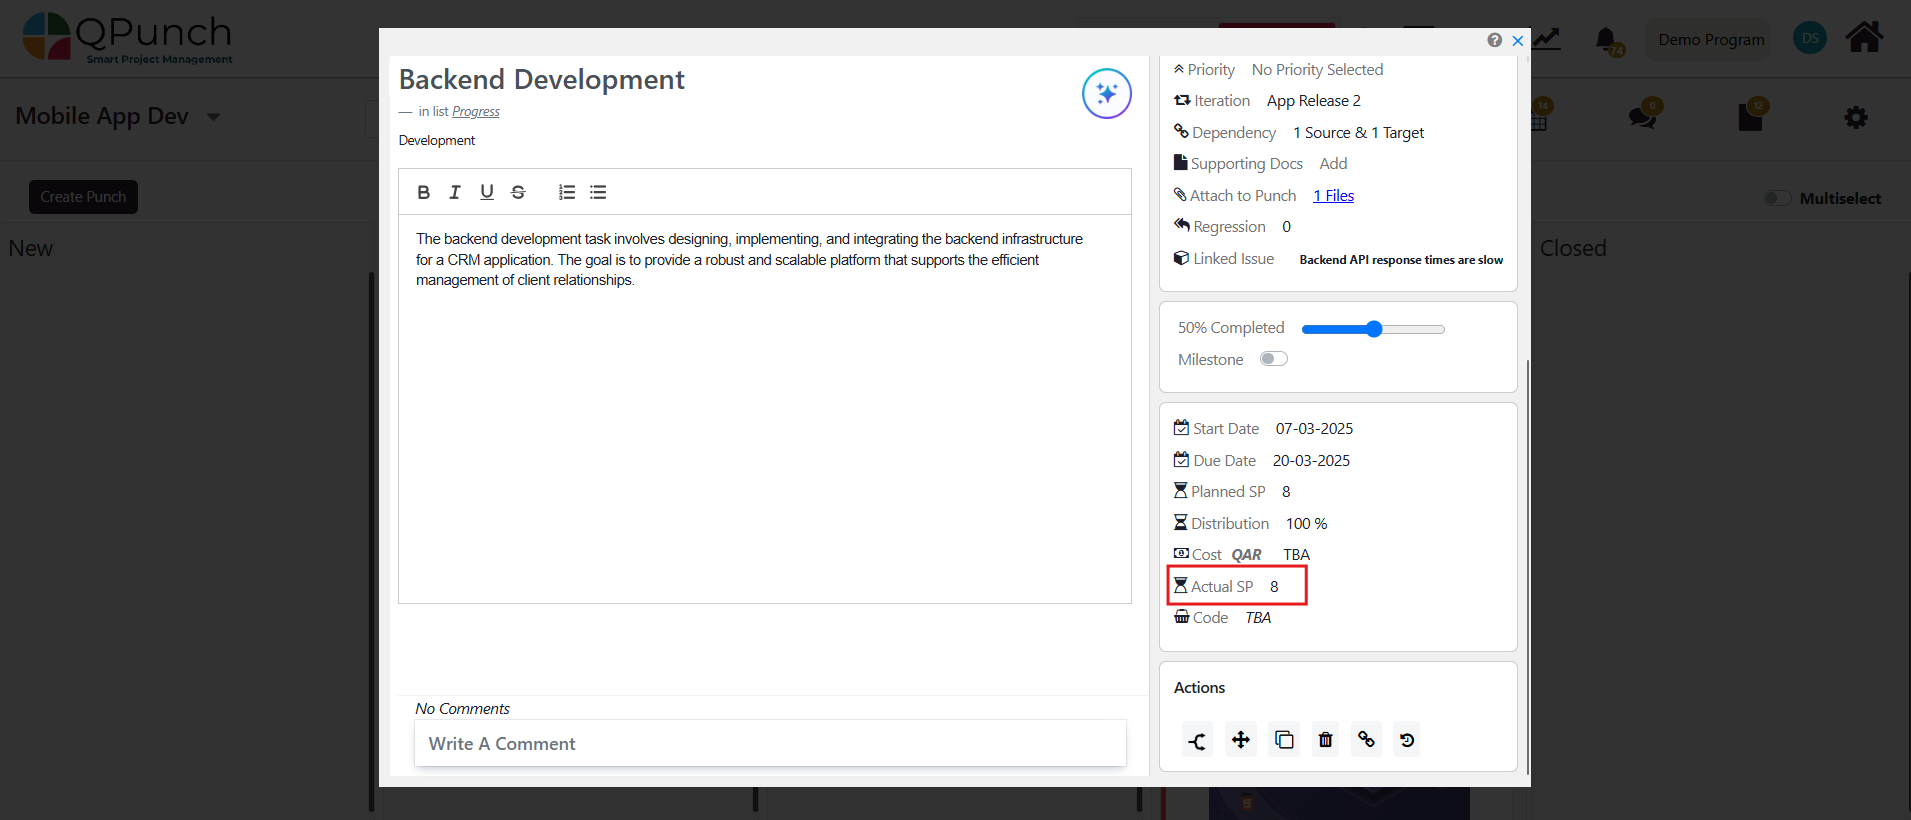
3. When a task is completed, open the task, and edit the Actual SP (Story Points) to reflect the final estimate.
4. Move the task from the Progress Lane to the Resolved Lane.
Note: The date that the task is moved to the Resolved Lane will be considered for the burndown chart.
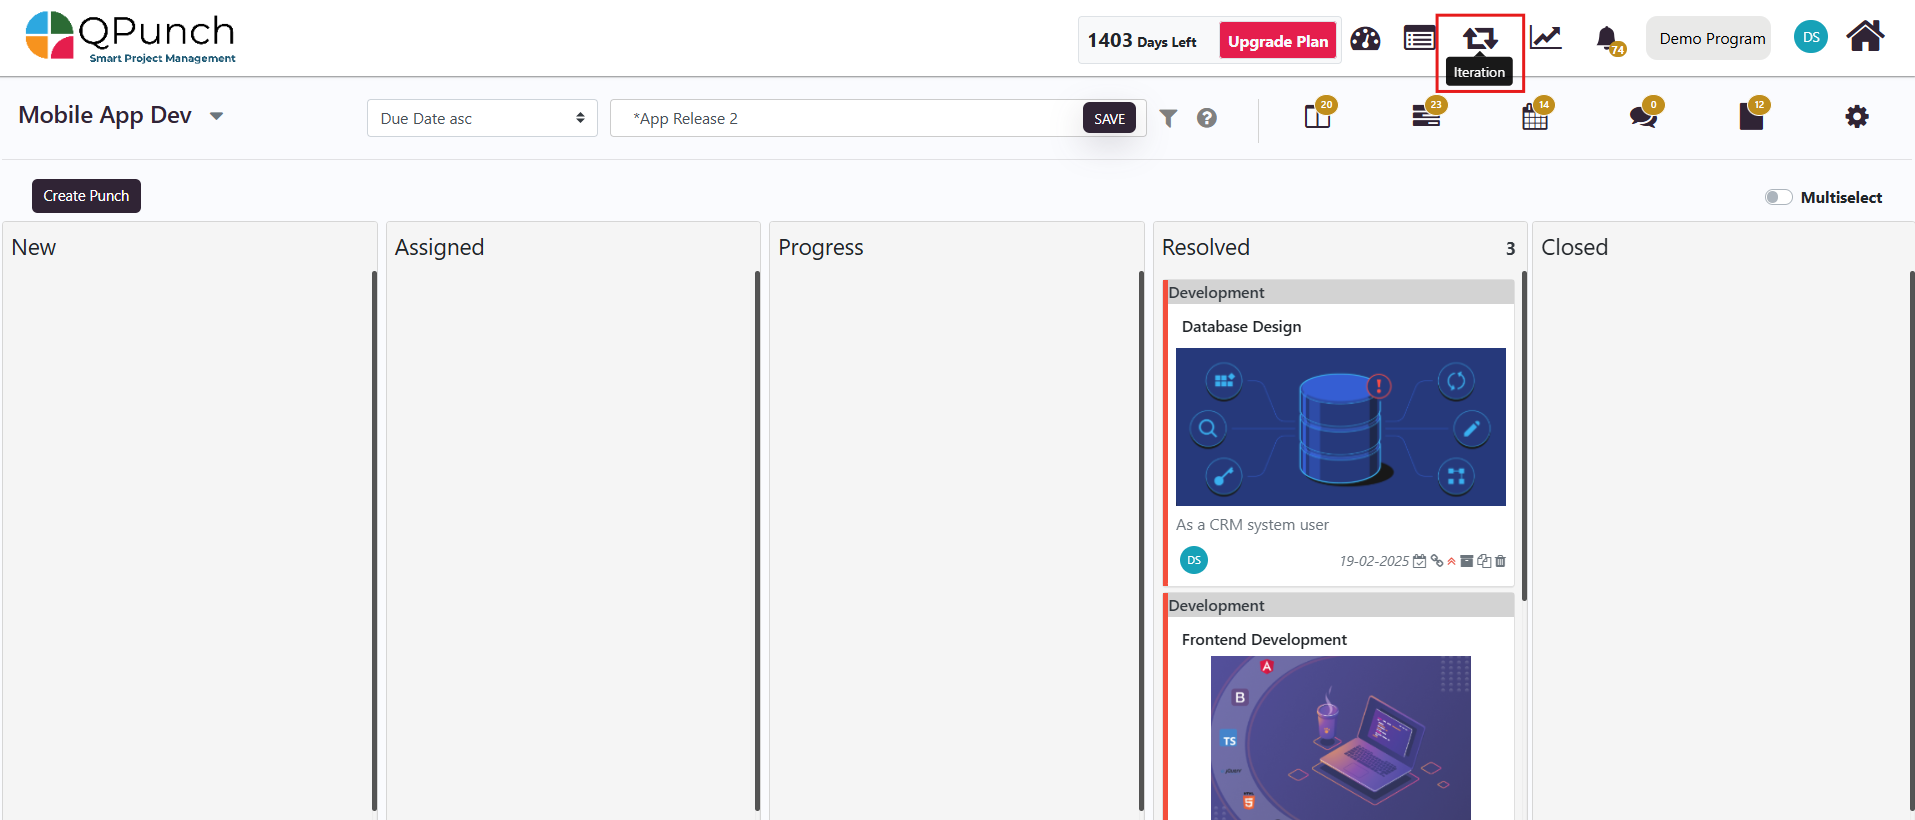
Viewing the Burndown Chart:
Once you have updated tasks and story points in your iterations, you can view the burndown chart for that iteration:
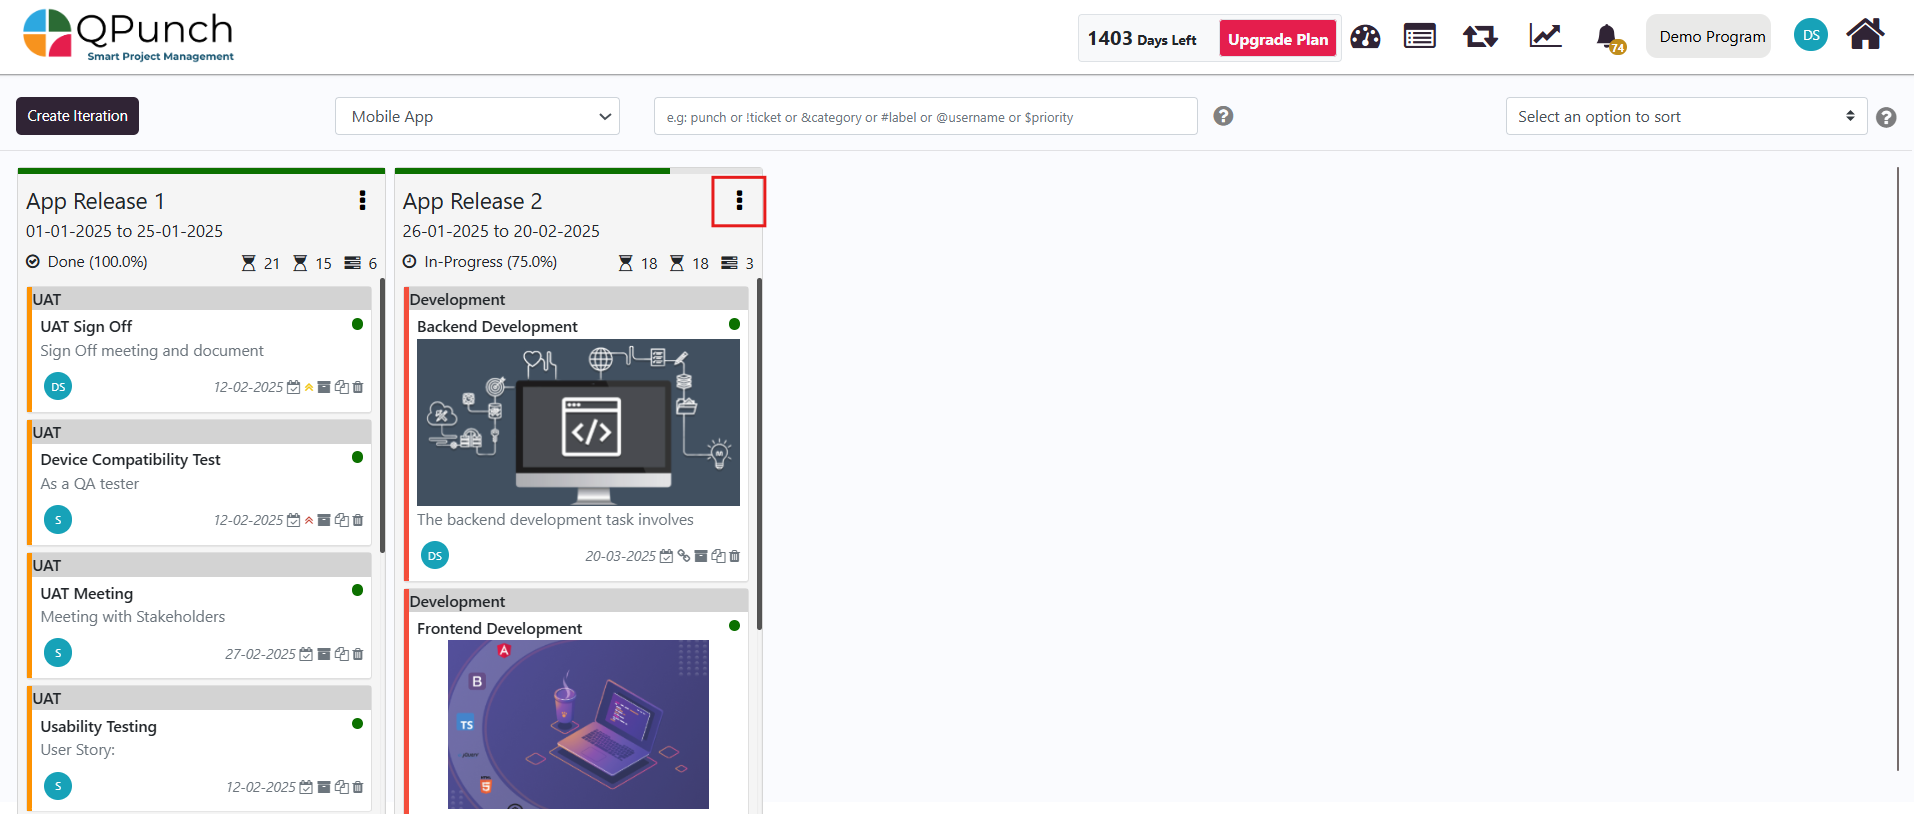
Navigate back to the Iterations view.
2. Click the three dots next to the iteration you wish to view.
3. Select Burndown Chart.
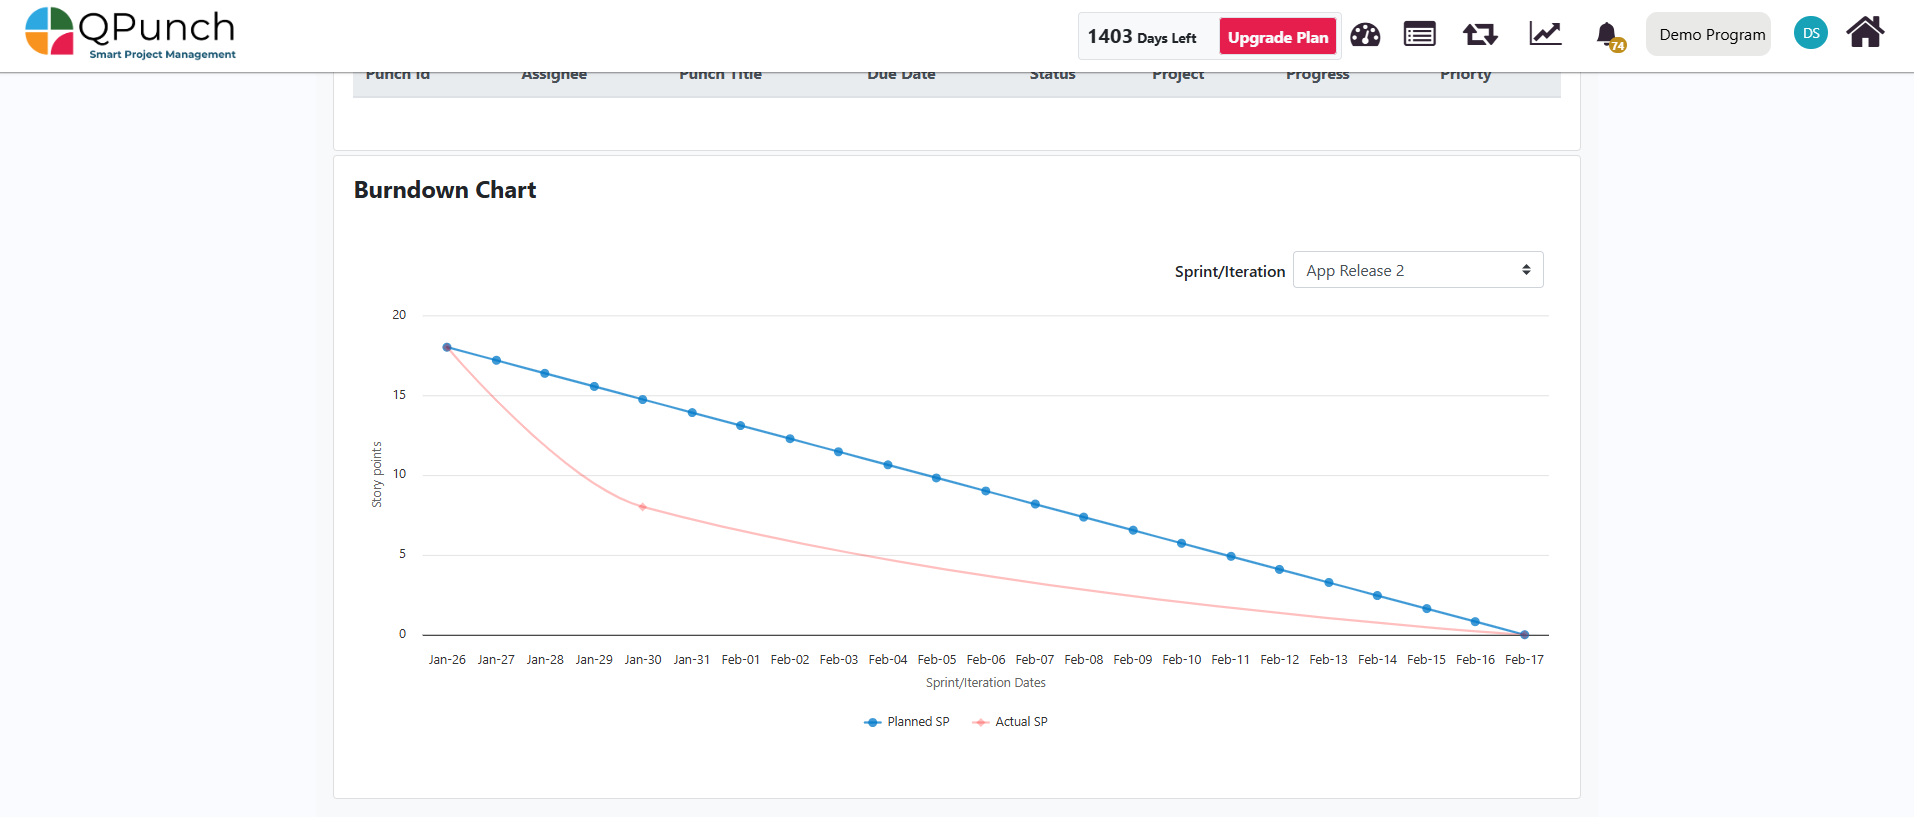
4. You will be redirected to the burndown chart, which visually displays the story points remainingagainst the sprint/iteration dates.
The chart has two key lines:
The Planned SP (blue) shows the expected progress of the iteration, based on the story points planned for the iteration period.
The Actual SP (red) reflects the actual progress made, based on the completion of tasks and the story points updated.
Note: If the Actual SP (red curve) is below the Planned SP (blue line), it indicates that the project is ahead of schedule and on track to complete the iteration on time. If the actual line is above the planned line, it suggests progress is slower than expected and adjustments may be needed.
Conclusion:
By following these steps, you can efficiently set up and manage burndown charts in QPunch for your Agile project. From enabling story points and managing iterations to updating task progress and tracking the remaining work through burndown charts, QPunch provides the tools you need to stay on track and measure your team’s efficiency within each sprint or iteration. Additionally, the ability to add and create punches directly within the iteration gives you greater control over your project’s workflow and task management.