Gantt Chart Overview

shape
shape
shape
shape
shape
shape
shape
shape

A Gantt chart is a project management tool which illustrates a project schedule and show the dependency relationships between activities scheduled over time.

Gantt charts are a visual view of tasks displayed against time. They represent critical information such as who is assigned to what, duration of tasks, and overlapping activities in a project.

All in all, Gantt charts are the perfect allies for planning, scheduling, and managing a project.

Gantt chart offers a timeline view which helps project managers and project teams to assess how long a project should take, determine the resources needed, understand the dependencies between tasks, and plan the order in which each task will be completed if the whole project is to deliver on time.

Benefits of Gantt chart:

  • Visual display of whole project
  • Determine task dependencies and time lines
  • Monitor progress of a project
  • Avoid resource overload
  • Relationships and dependencies between the various activities

Step 1: Navigate to the Gantt chart

In the QPunch dashboard we can see multiple projects and each project have their own Gantt chart. Select the above icon to navigate to the Gantt chart.

 If you are already inside any of the project

Select the above icon to navigate to the Gantt chart.

Step 2: import MS project  

Option 1:  We can import MS project file while creating a new project using wizard

Option 2:

  1. On the Gantt chart menu, Click import

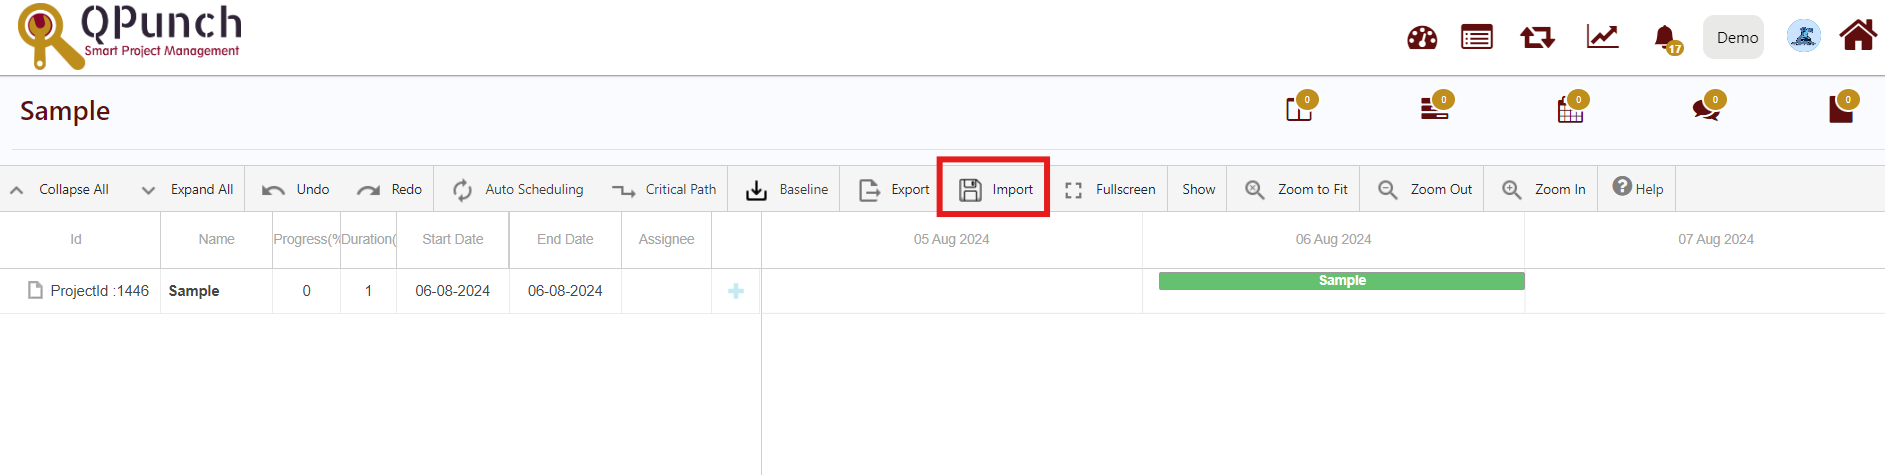
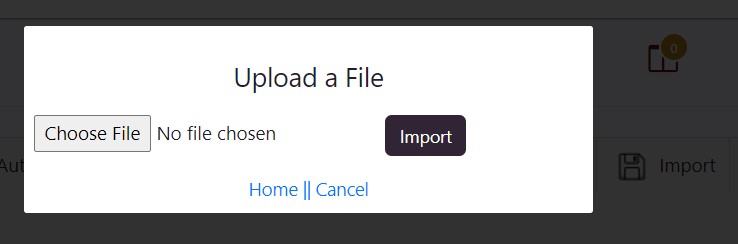
2. Click choose file and select the .mpp file from the folder and then click import.

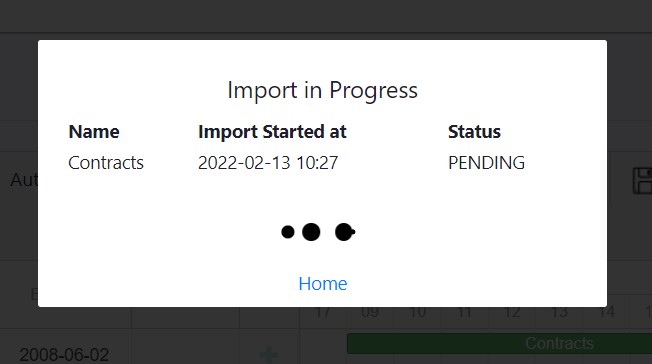
3. After clicking on import, it will start importing the file.

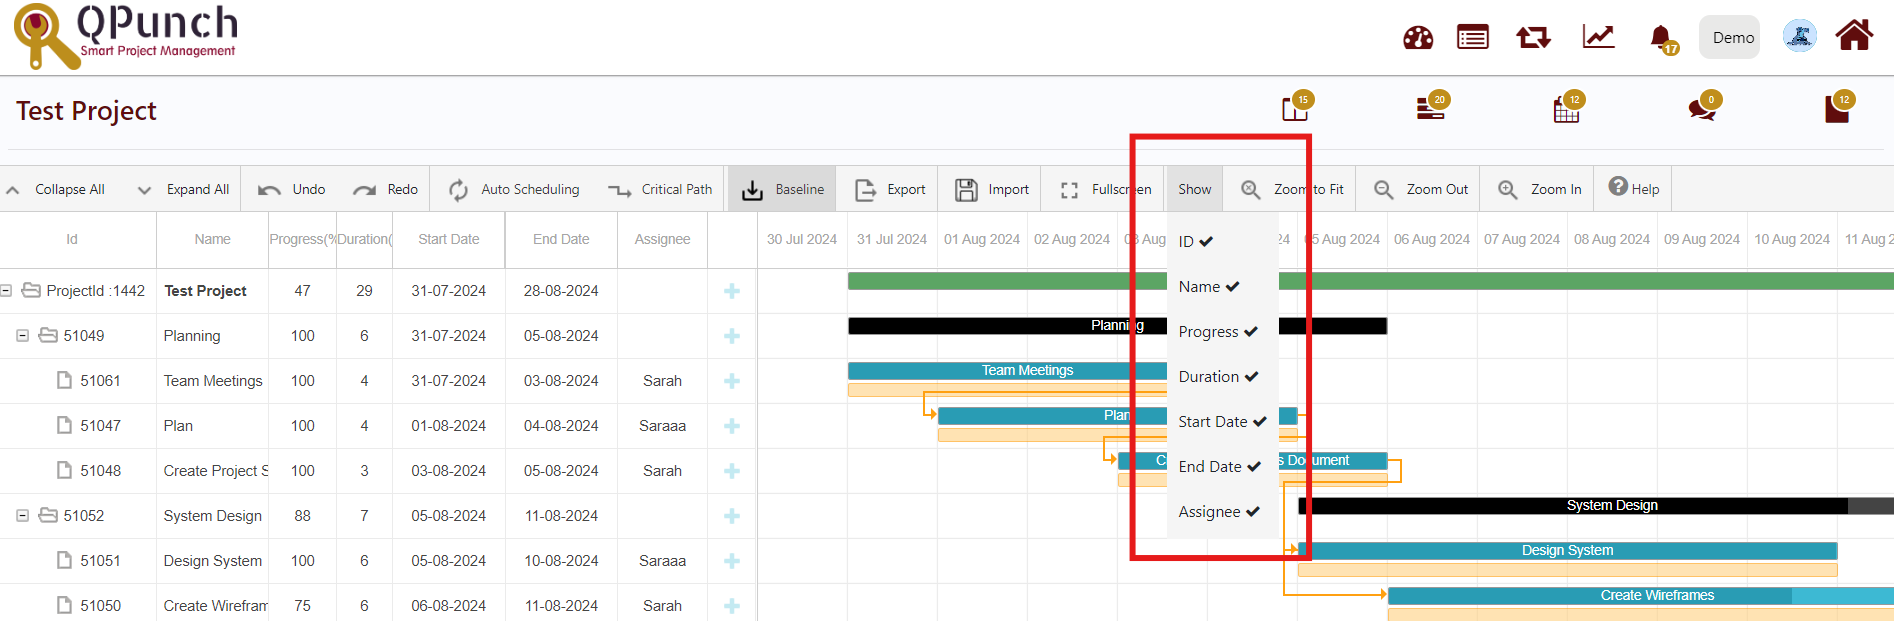
Advance performance options permit you to work with huge Gantt charts with 1000s of tasks.

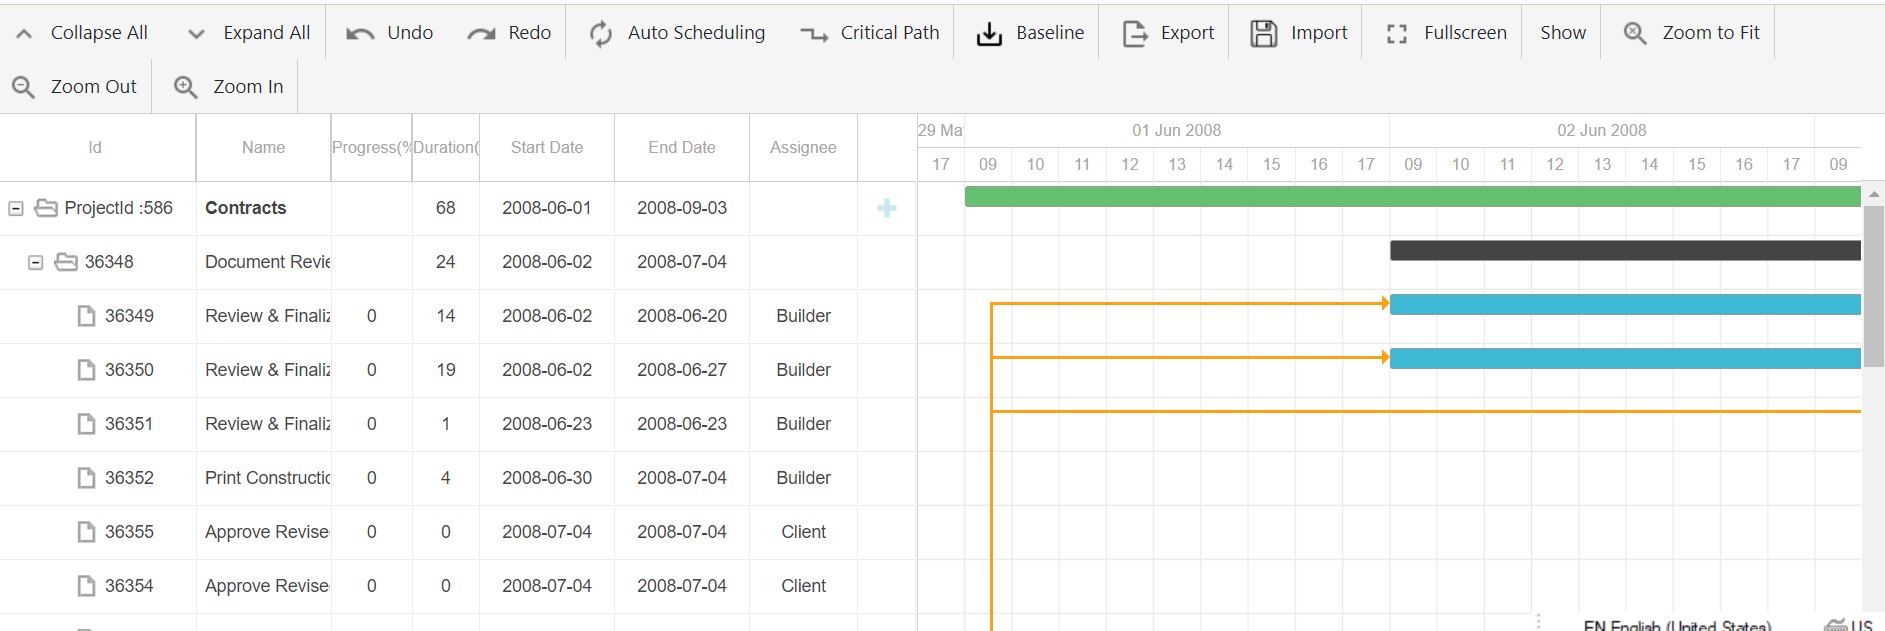
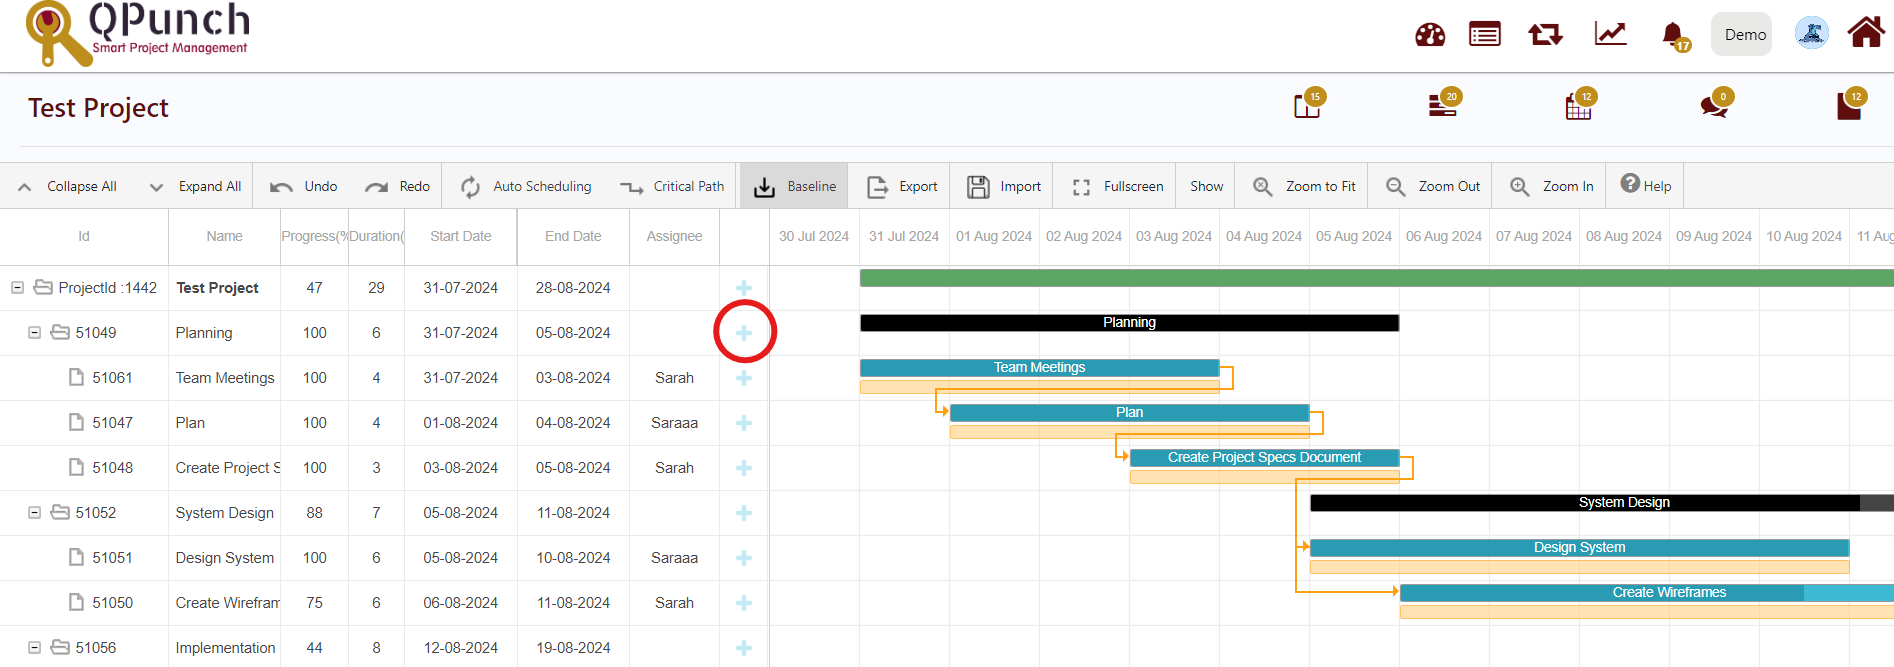
Gantt chart typically includes two sections.

  1. Left side outlines a list of tasks

It usually represents a hierarchy of tasks that are broken into smaller tasks.

Project name is placed on the top and they are split into various group tasks and sub group tasks and those are split into tasks.

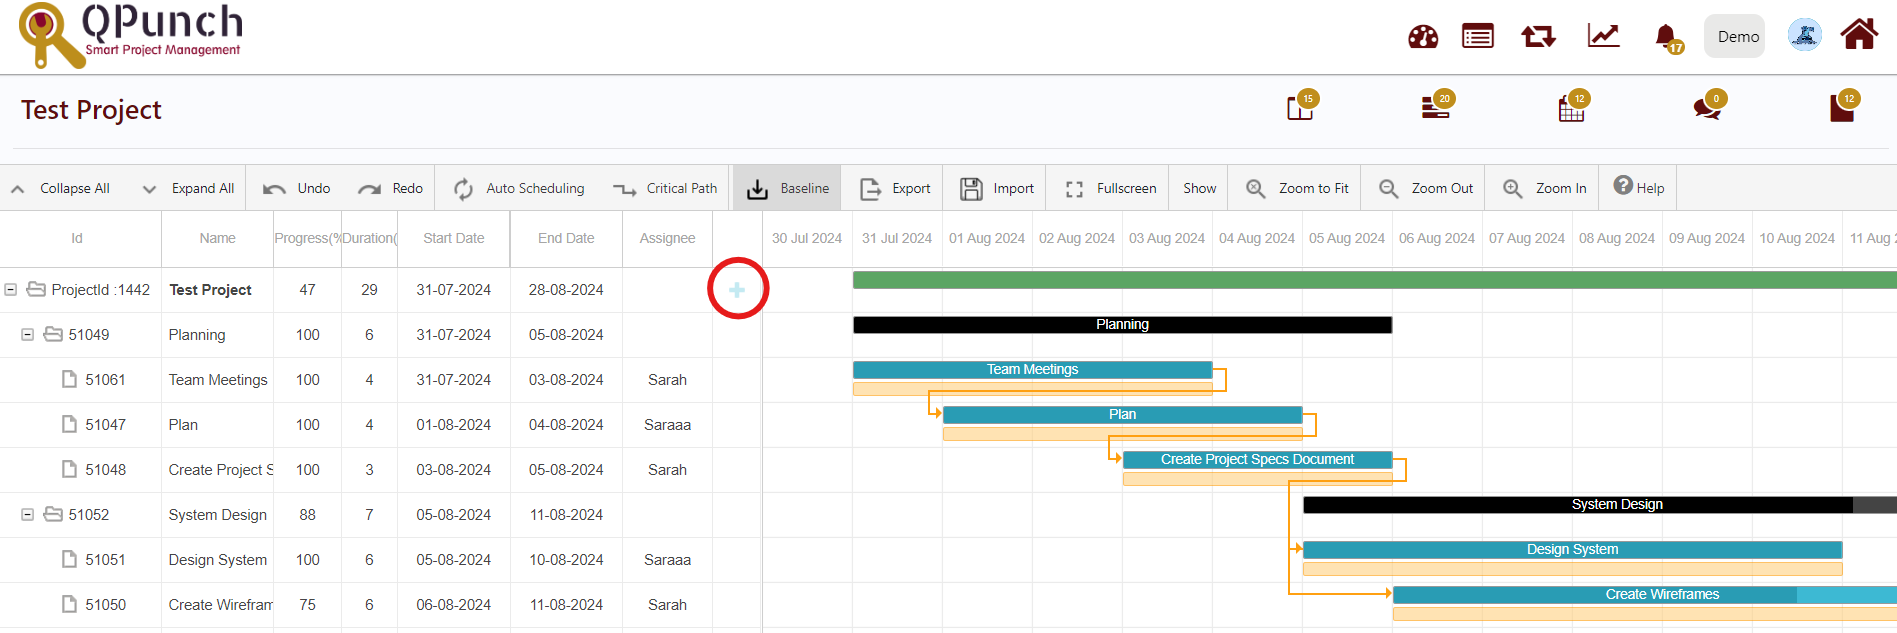
  • Tasks: The deepest level issues within your hierarchy become task bars, by default.
  • Groups: Non-issue items, such as Folders, as well as issues containing sub-issues, become Groups, by default. A group starts at the earliest start date of its sub-items and ends at the latest end date.
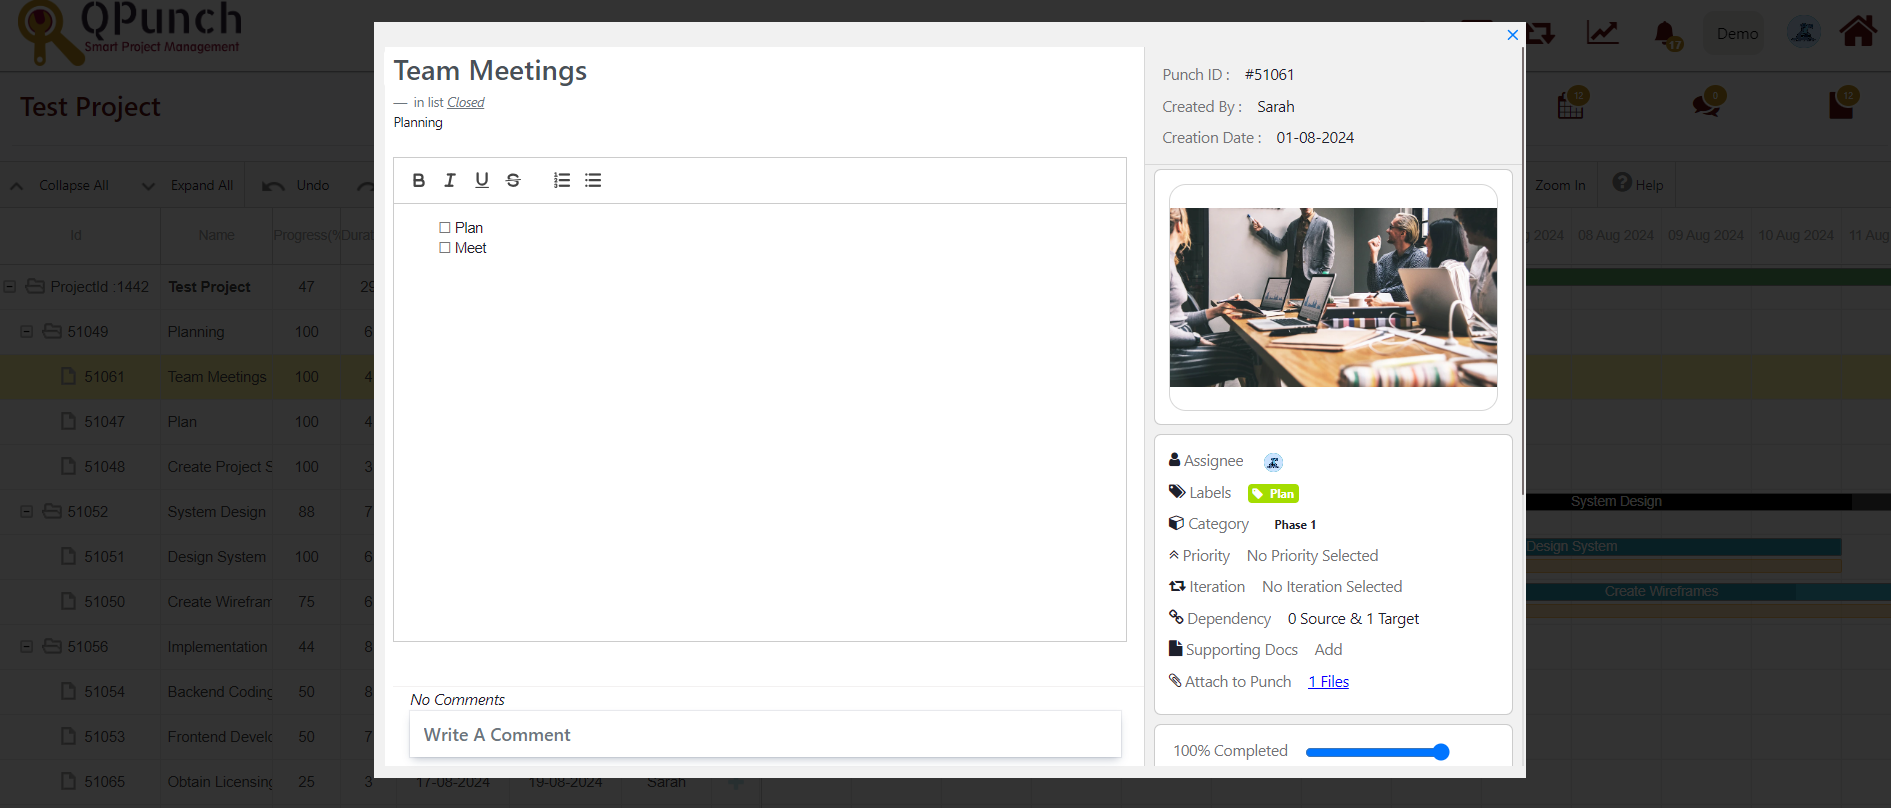
  • Milestones: It allows you to mark a key point within a project plan.
  • Dependencies – It allow you to visualize links between issues and other items.

Left side contains the following columns:

              Id, Name, Progress (%), Duration, Start Date, End Date, Assignee.

Click Show tab and hide any of these columns by unchecking the corresponding item in the list.

  • To add new tasks in the existing Gantt chart:
  1. Navigate to the Gantt View

2. Click the plus (+) icon to add new task. A pop up will appear to create a new task

  • Below the Description we can replace New Task with a different task name.
  • Below the Time Period we can set the start date of the task. By default, it is taking Due date as 1 day after the Start Date. We can change it by increasing/decreasing the count.
  • Click Save to add the task or if there is any change of mind you can either Delete/ cancel it.
  • To open the task and include other details regarding the task, Navigate to the corresponding task.

Entire row of the task would be highlighted with yellow color. Click anywhere in that row and the task would open up.

  • User can add/modify the details regarding the task and close it.
  • To add sub tasks in the existing Gantt chart:
  1. Navigate to the project settings.

2. Select the Project Configuration and toggle on the Group Task.

3. Click Update button and navigate back to the Gantt view.

4. Now the plus (+) icon will be visible next to the Assignee column. Click the plus (+) icon to add new task in between the existing task.

2. Right side has a timeline with schedule bar that visualize works.

In this User can see:

  • The Start Date of the project schedule
  • What the project tasks are
  • Which team member is working on each task
  • When activities start and finish
  • The percent complete for each activity
  • How tasks group together, overlap and link with each other
  • Task dependencies such as finish-to-start, start-to-start, finish-to-finish and start-to-finish
  • Milestones and project phases of the schedule
  • The critical path of the project
  • The finish date of the project

Learn more by reading Gantt chart elements

Leave a Reply

Your email address will not be published.