The Executive Report in QPunch provides a comprehensive overview of your project outcomes and progress. It allows users to track the status, benefits, and milestones of various projects, helping stakeholders stay informed and make data-driven decisions. This guide will walk you through the steps required to set up, navigate, and update the Executive Report, ensuring you can track and manage your project outcomes efficiently.
Setting Up Outcomes Toggle Permissions:
To ensure you can access the Executive Report, make sure the Outcomes Toggle permissions are enabled for your account. This is set by the subscription owner using the following steps:
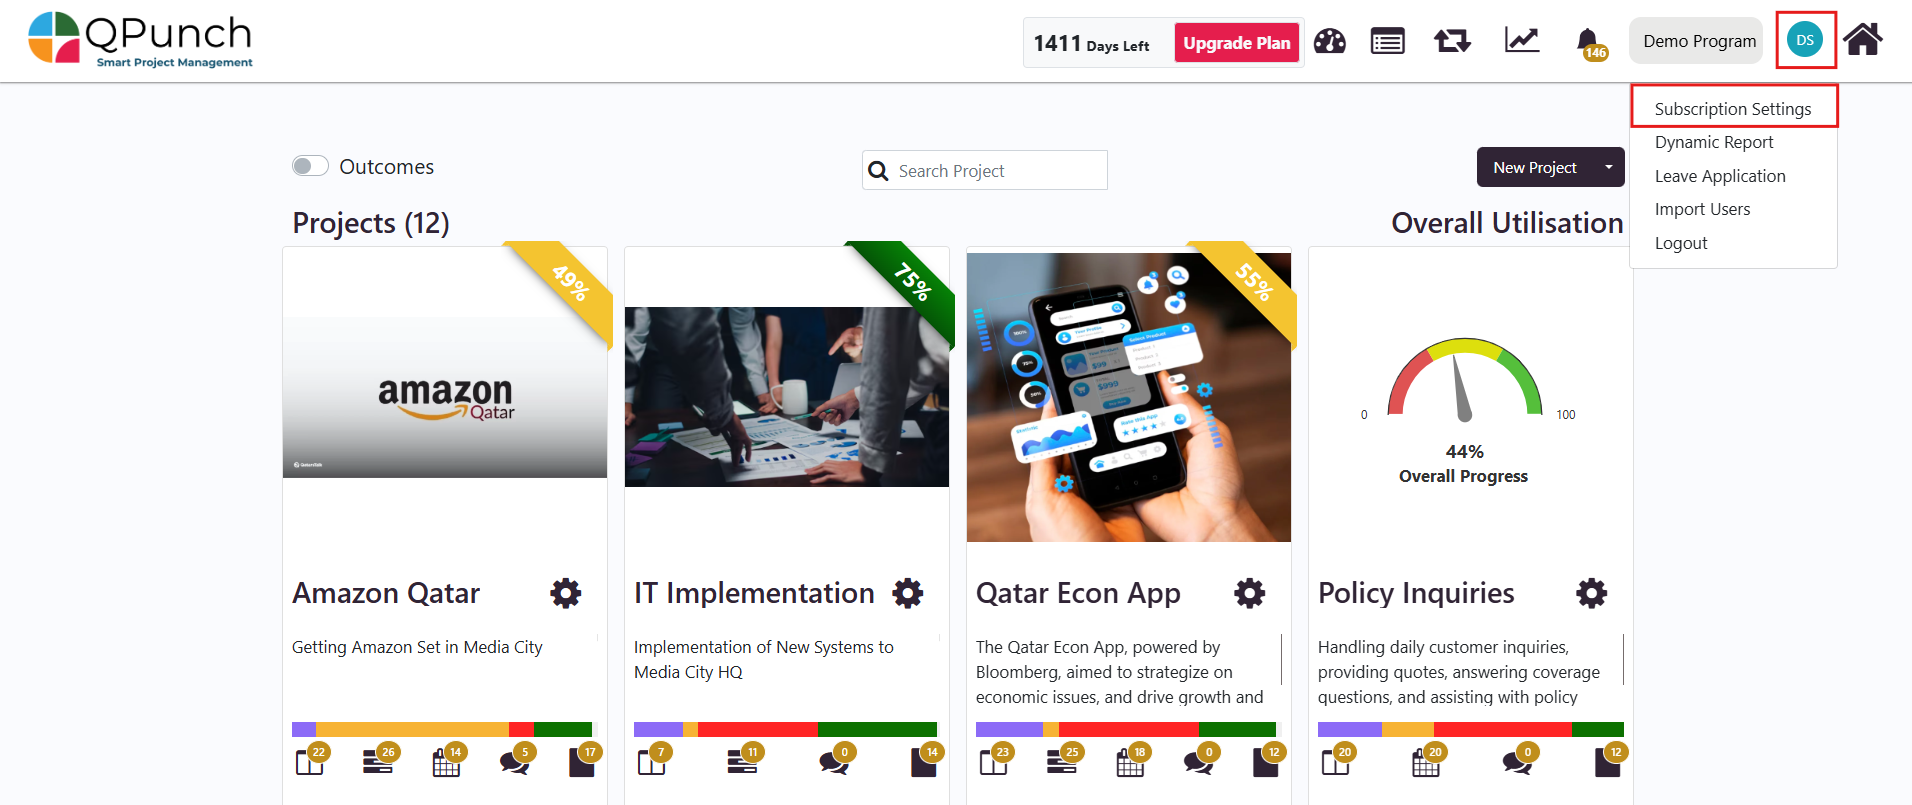
Click on the User Profile icon.
Choose Subscription Settings from the menu.
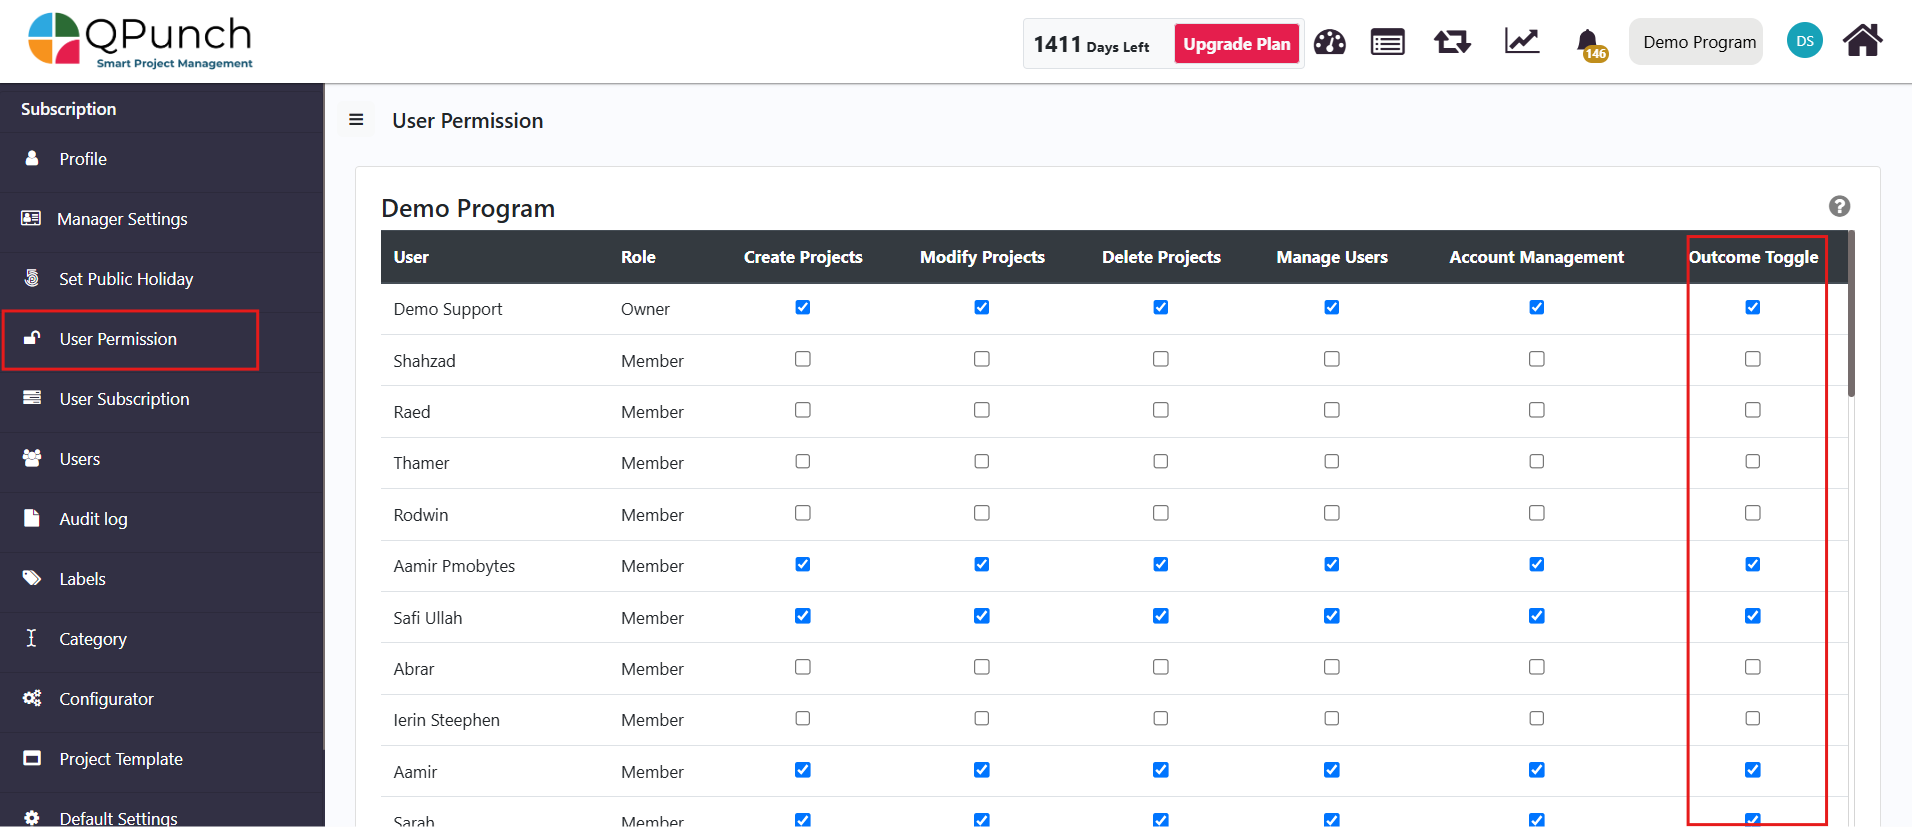
3. In the side menu, navigate to User Permissions.
4. Locate the user’s name and ensure the ‘Outcomes Toggle’ option is checked for the desired users. This will grant them the necessary permissions to view the Executive Report.
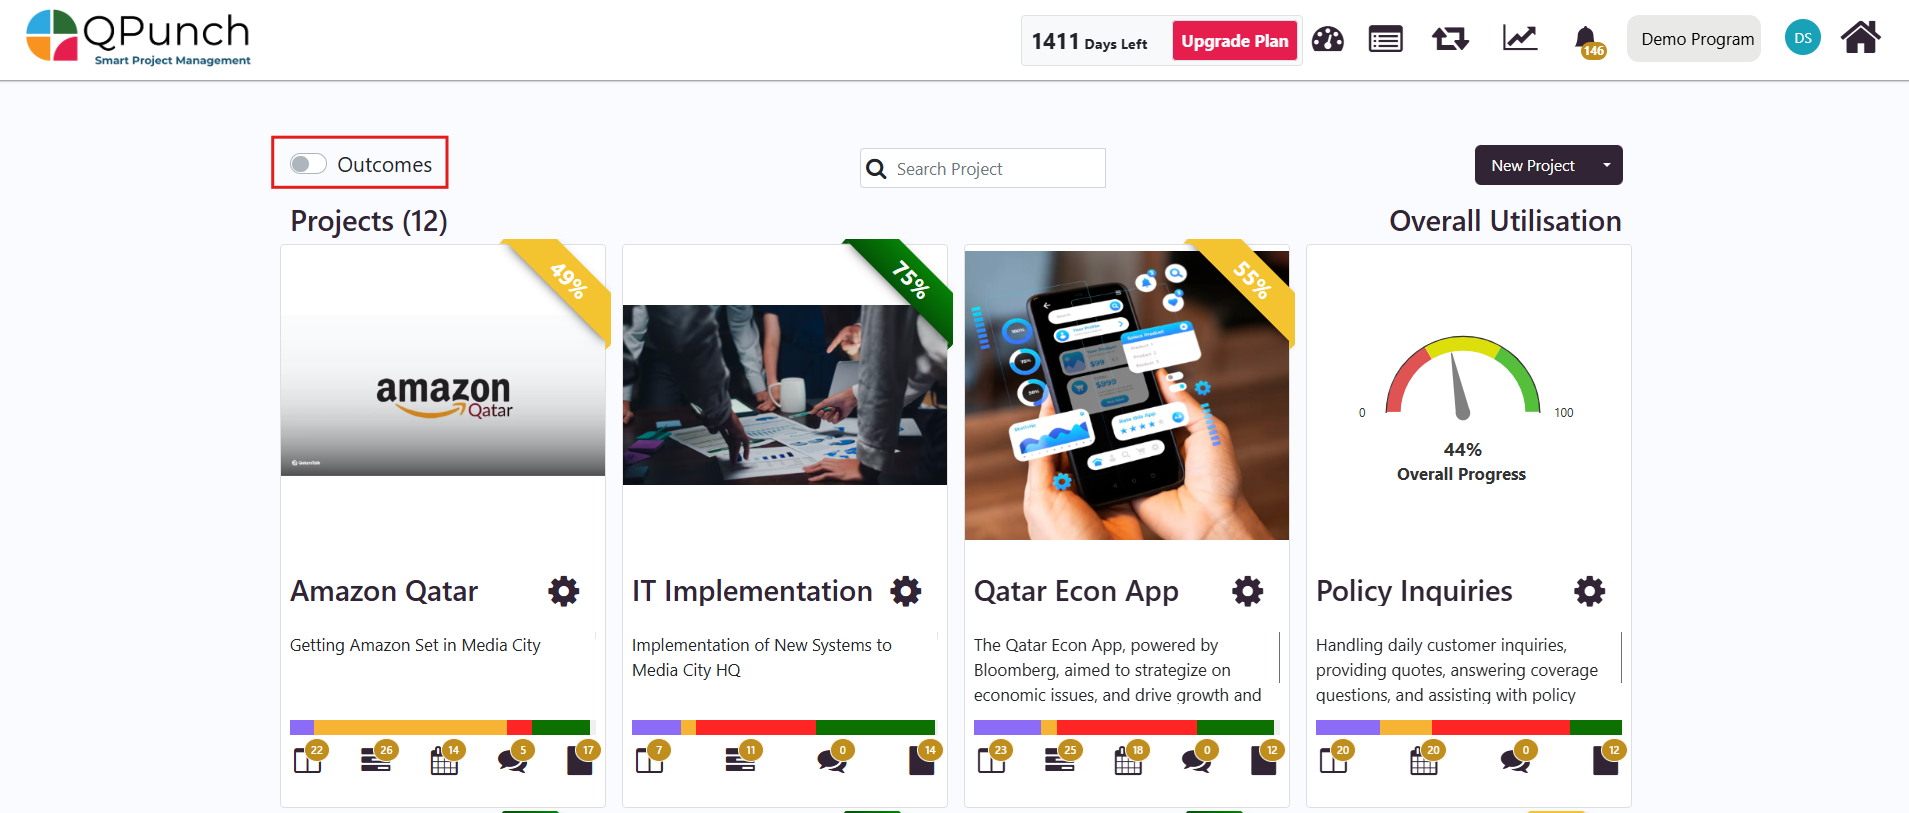
Navigating to the Executive Dashboard:
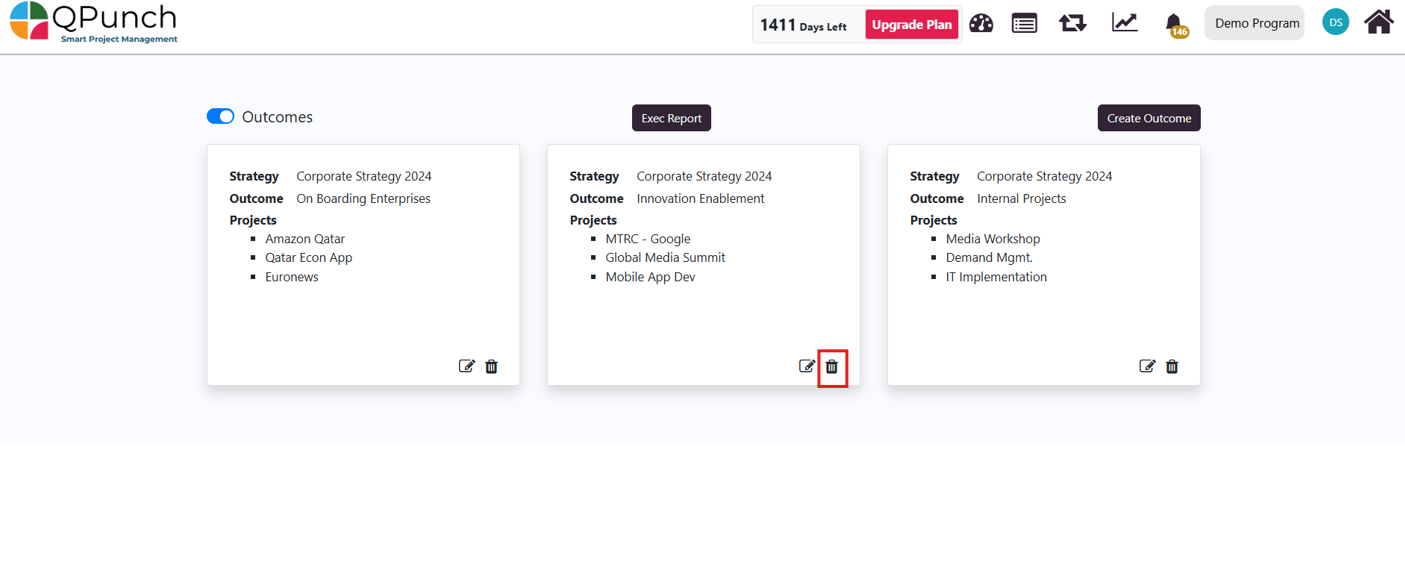
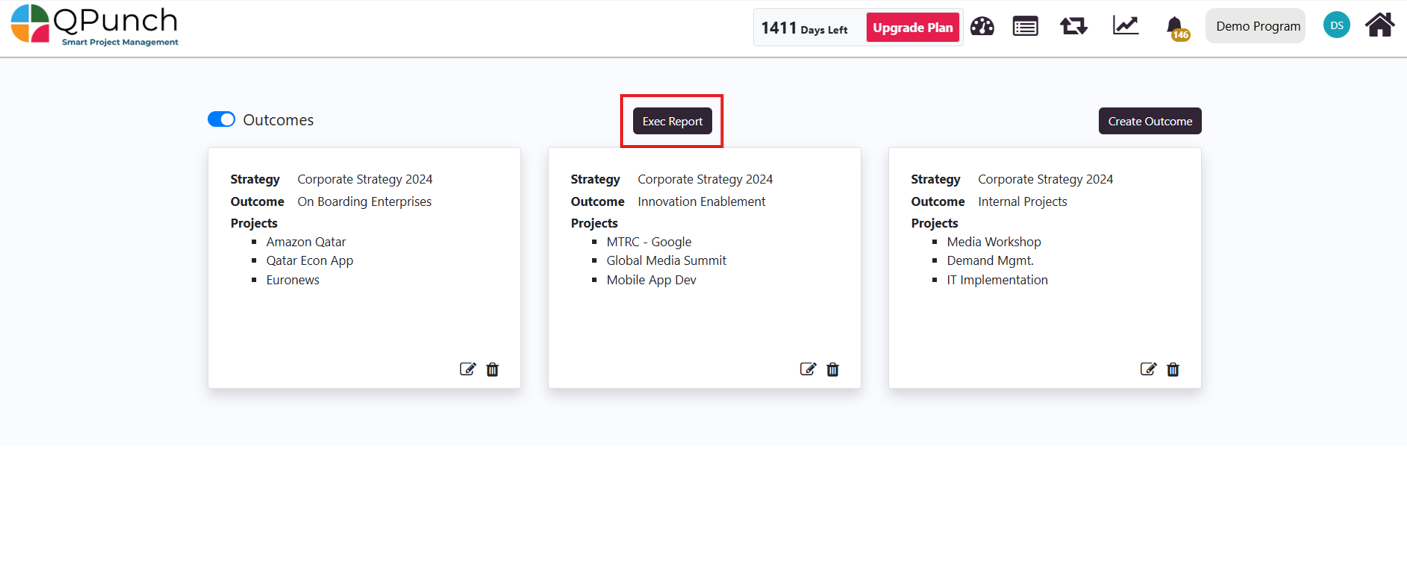
From the Home page, enable the Outcomes Toggle above the projects.
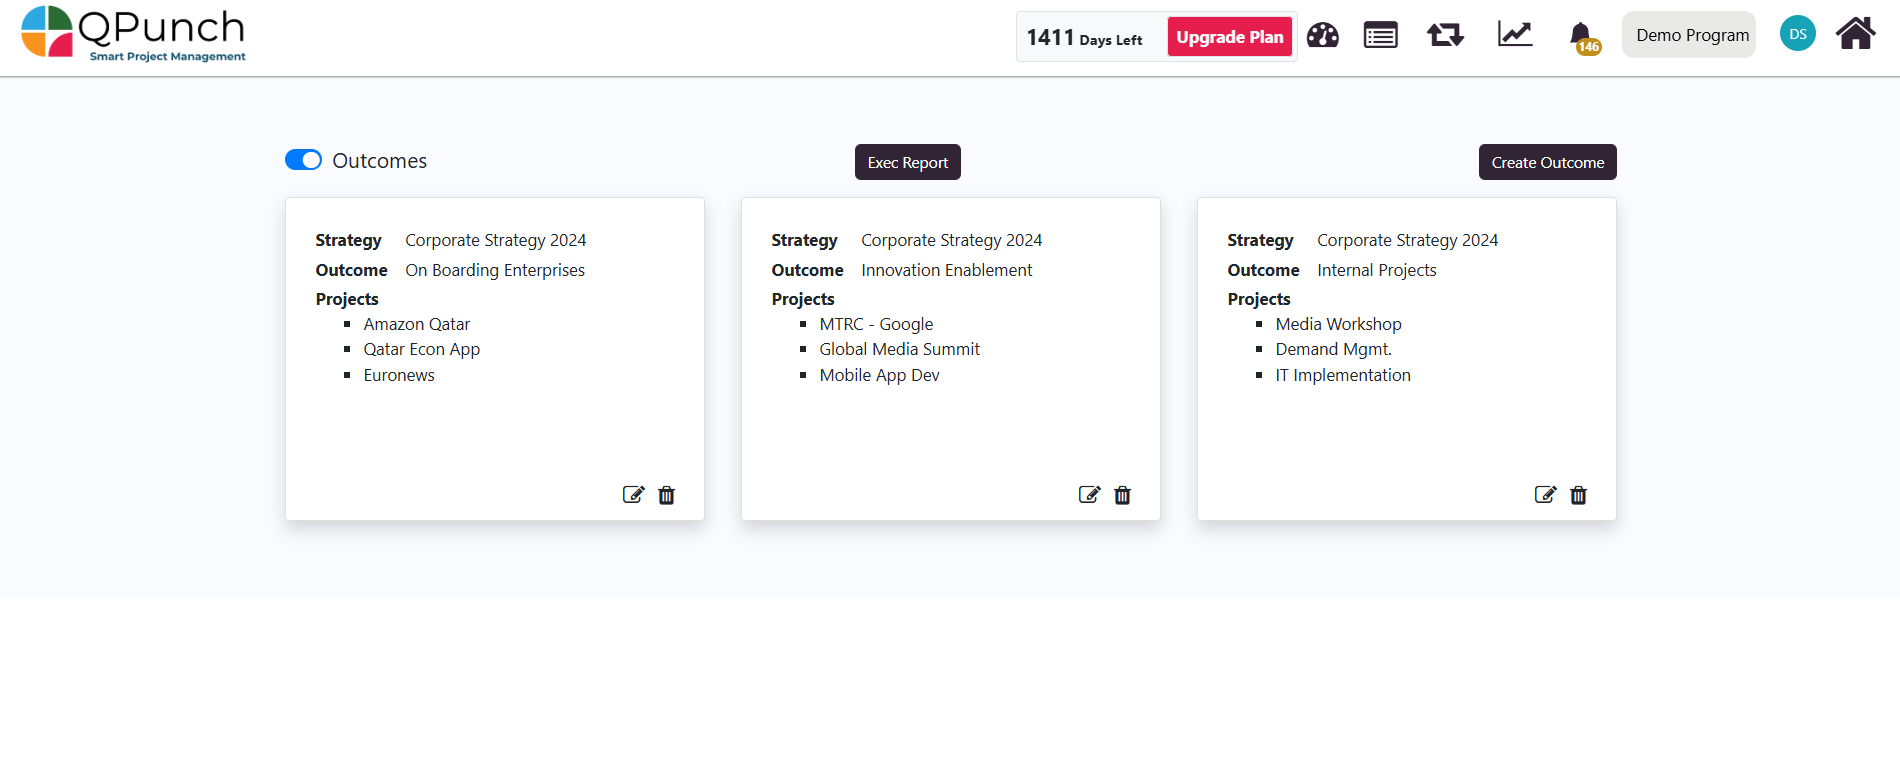
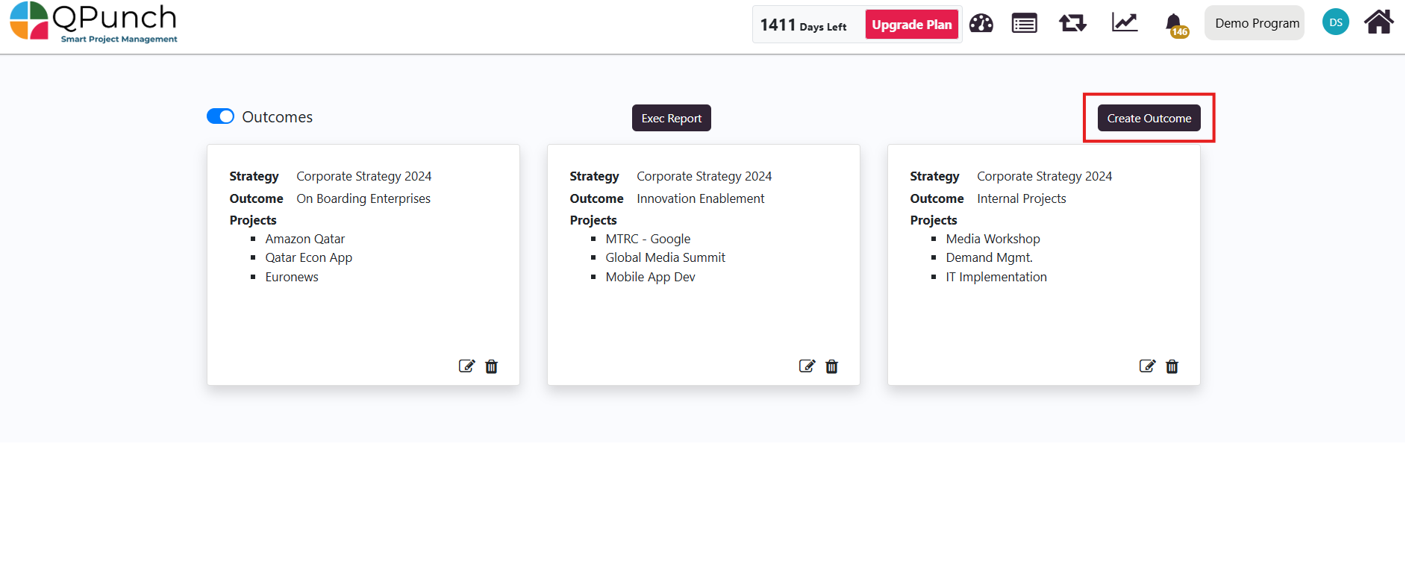
2. The dashboard will display existing outcomes in cardboard view along with the associated project details for each outcome.
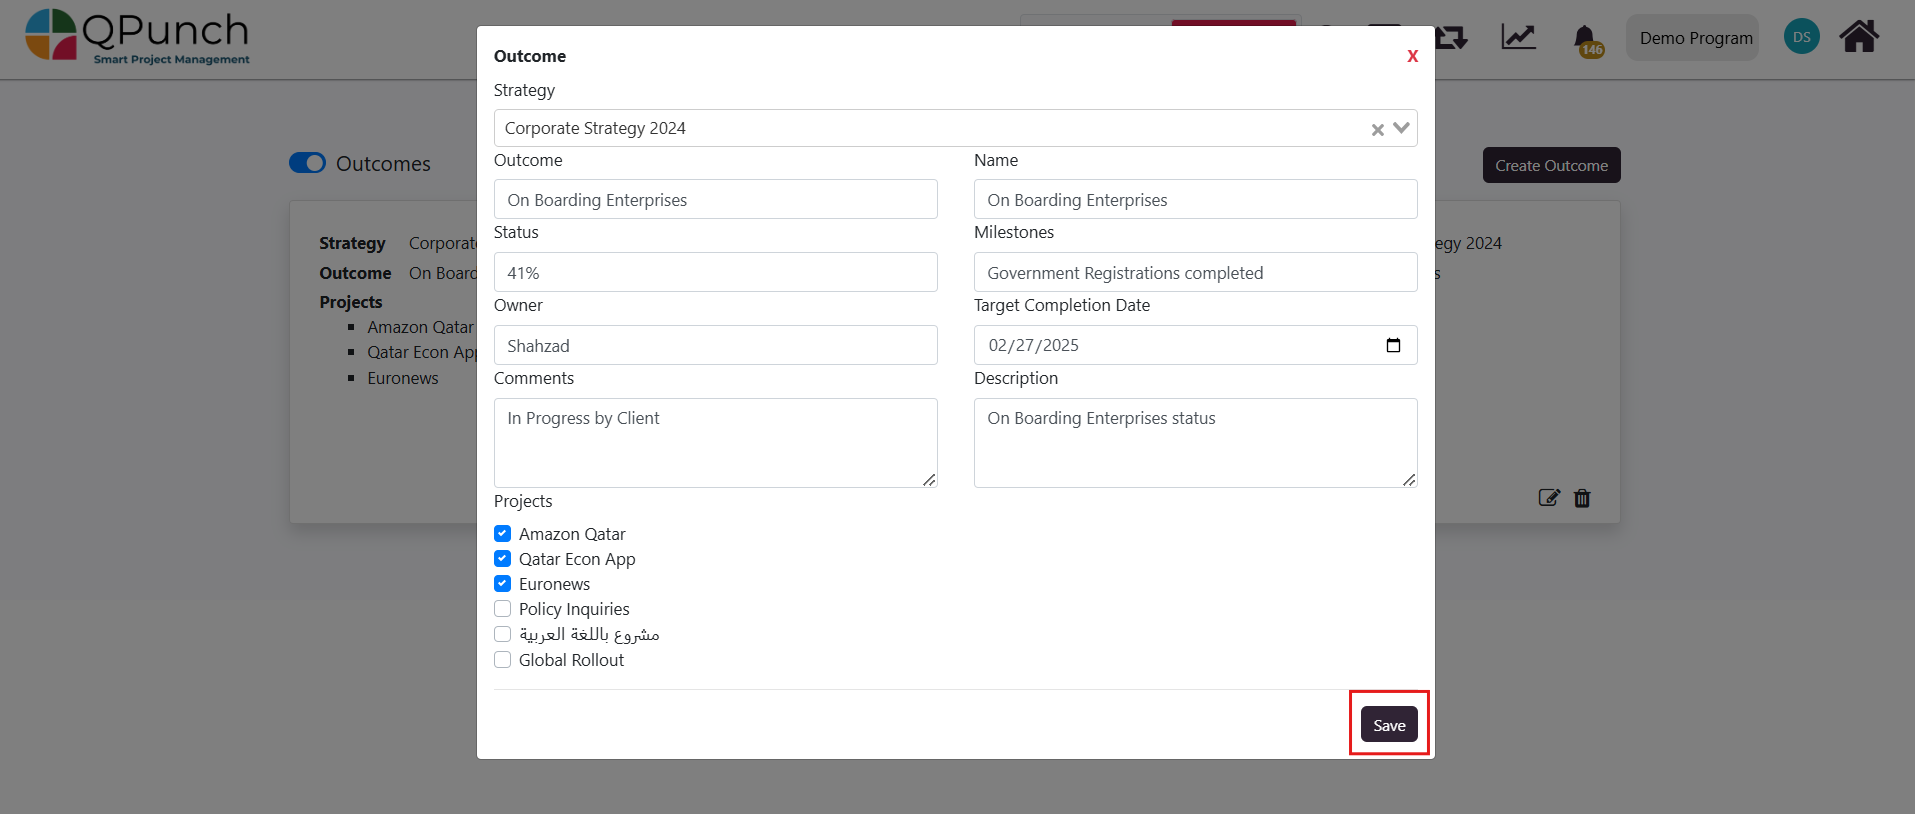
3. To edit an existing outcome:
Click the Edit button next to the outcome.
Make the necessary adjustments, then click Save once done.
4. To delete an outcome, click the Delete button.
5. To create a new outcome:
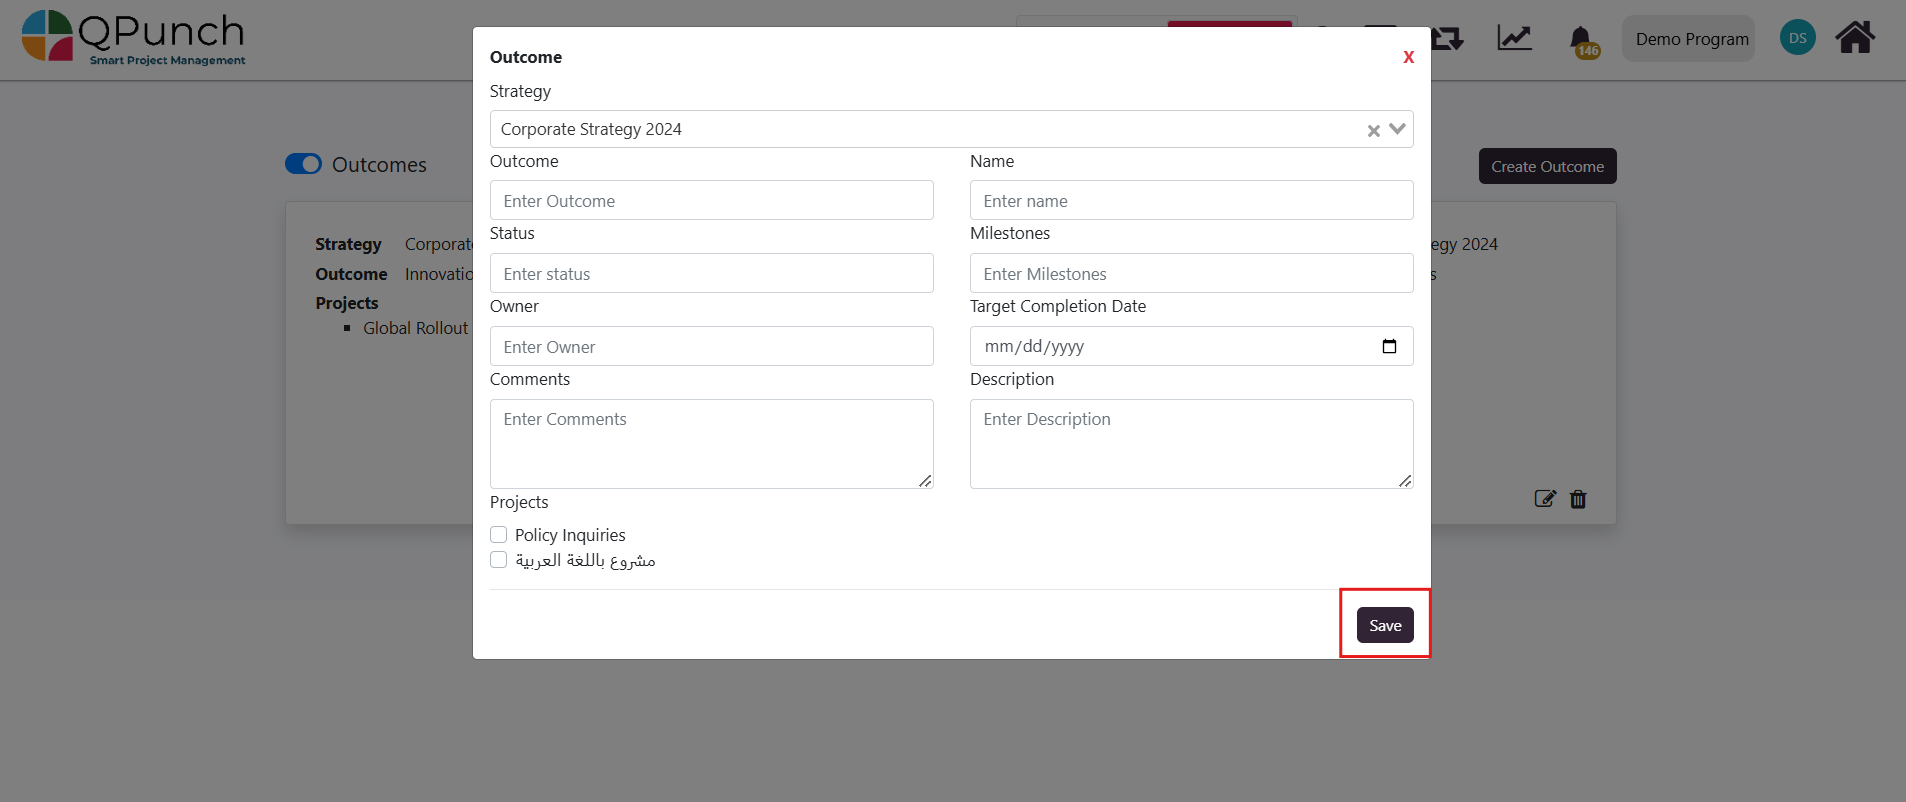
Click the Create Outcome button.
A pop-up box will appear where you can add details such as outcome name, status, milestones, owner, target completion date, description, and any additional comments.
You can select projects that have not been assigned to an outcome (unclassified projects) to include in the new outcome.
Click Save once the new outcome’s details are filled.
Creating and Managing Outcomes:
Once you’ve created your outcomes, you can easily access and update the Executive Report:
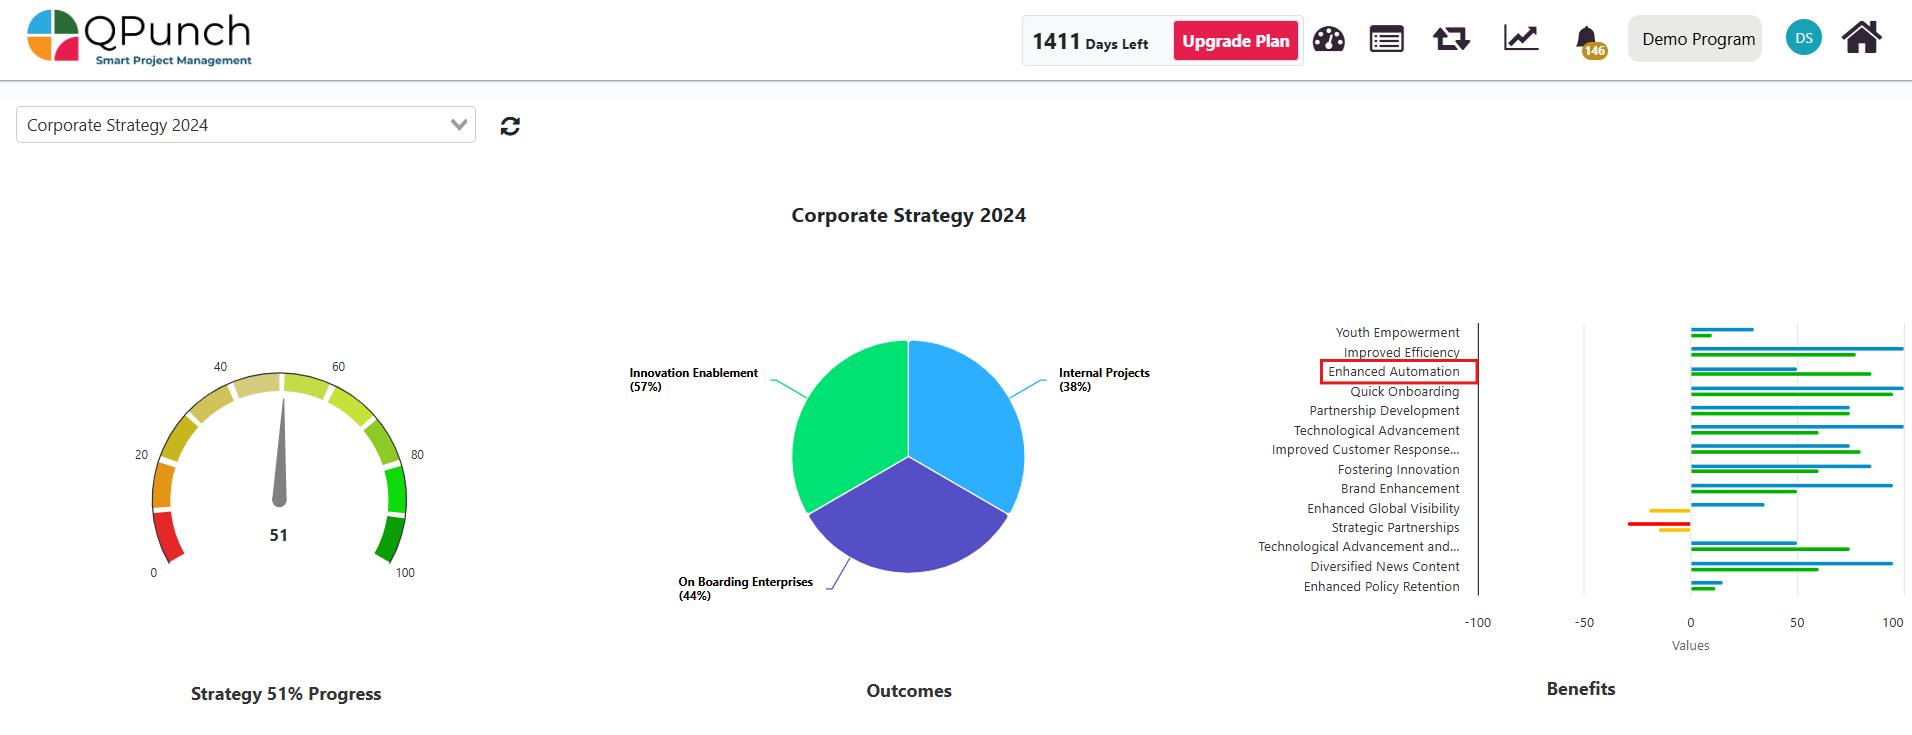
Click on the Exec Report button to navigate to the Executive Report dashboard.
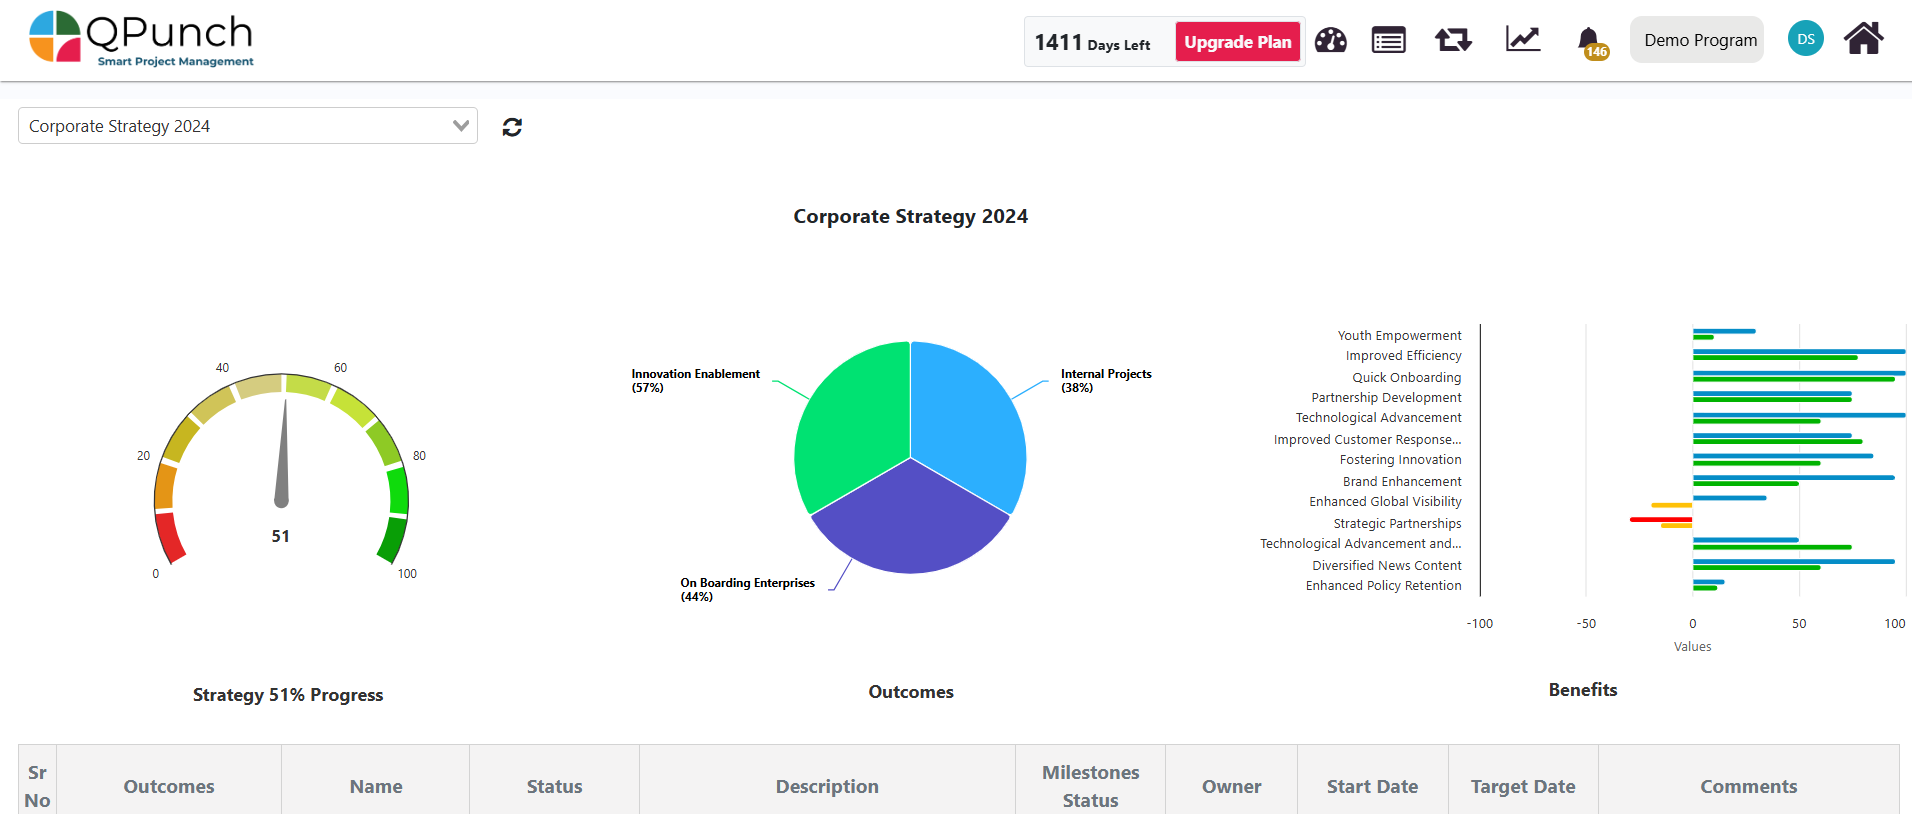
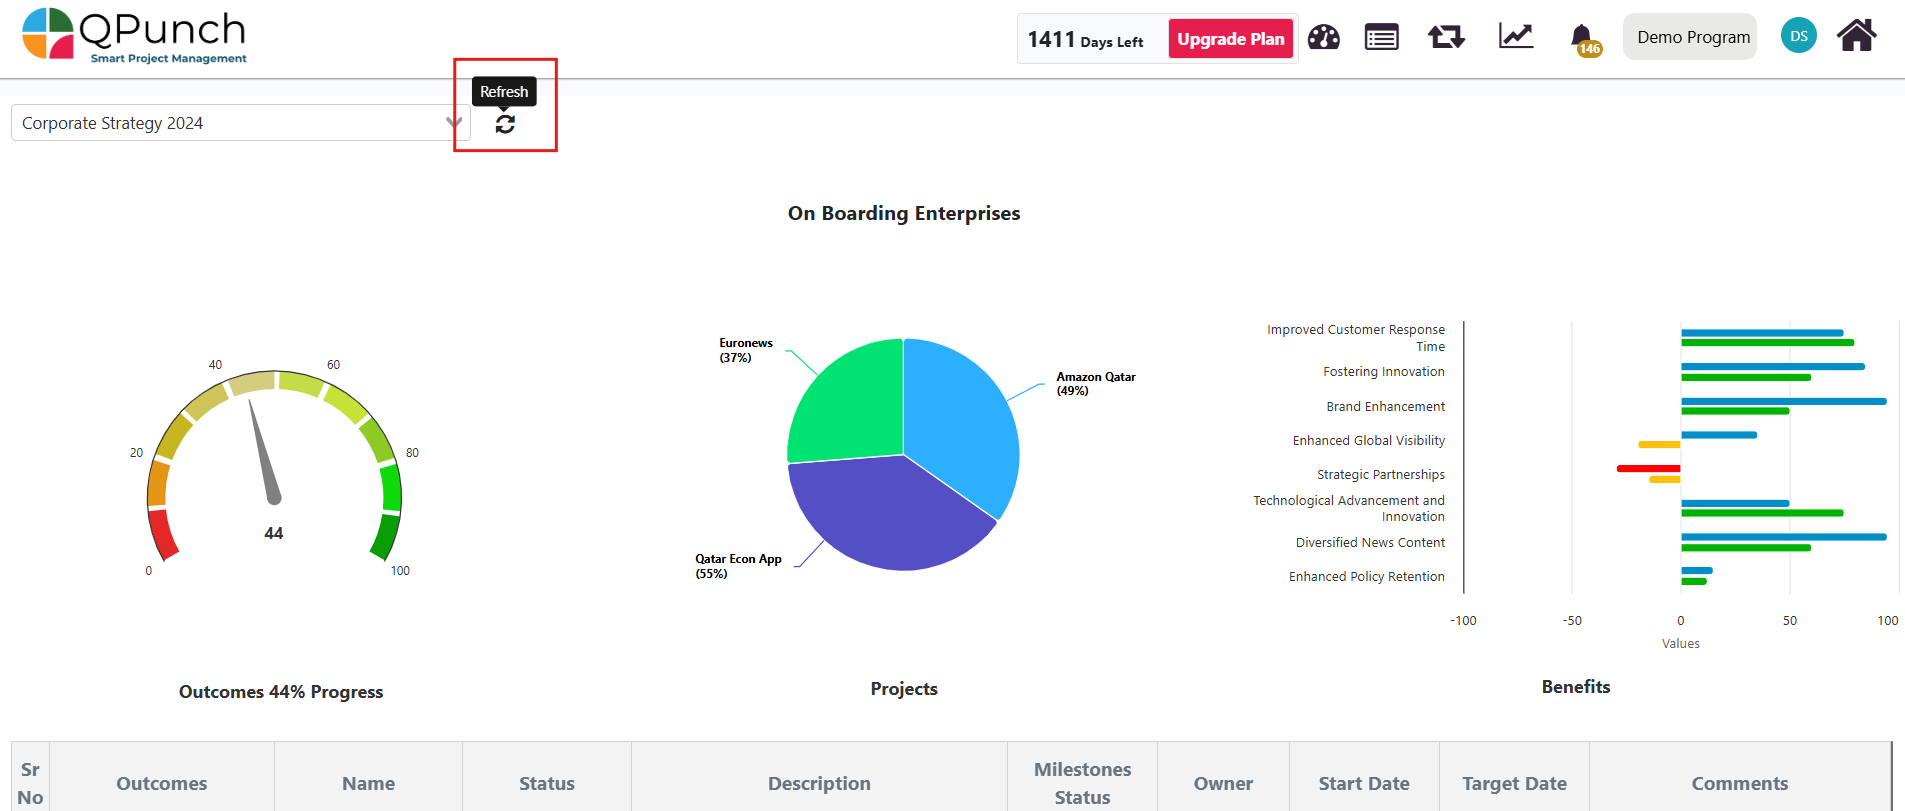
2. The Exec Report will display three key charts:
Overall Status Progress % speedometer for all projects
Outcomes pie chart showing progress for each outcome.
Benefits shown as a double line chart displaying expected and actual benefits alongside their achieved values.
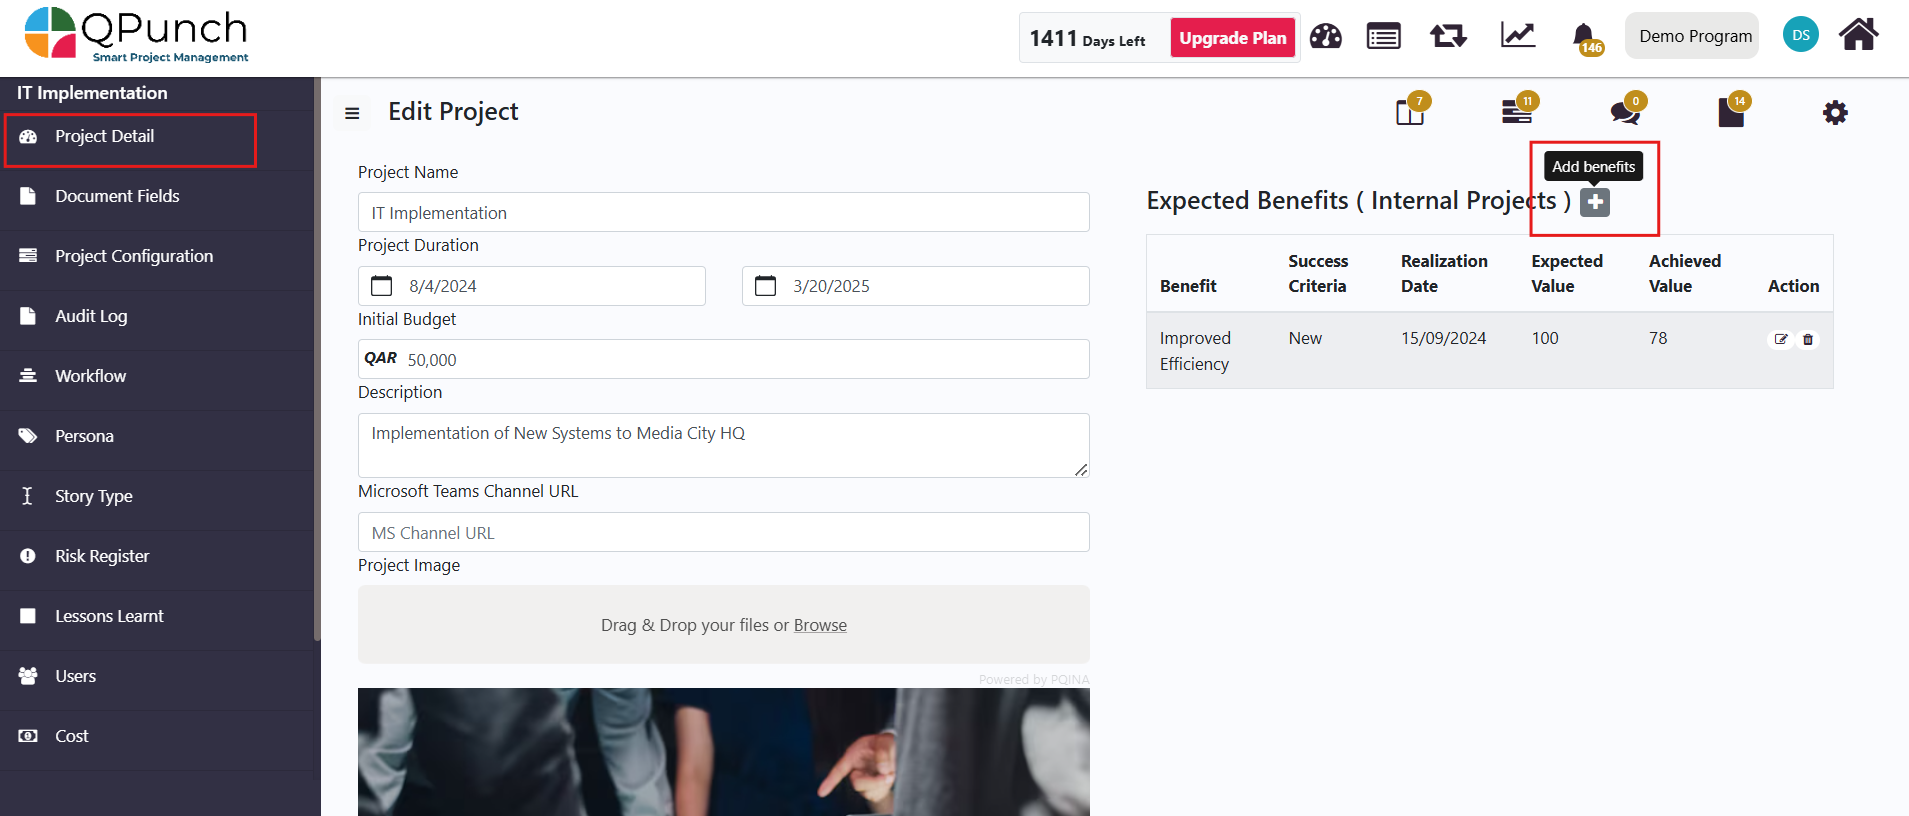
Adding Benefits to the Graph:
To add expected benefits for a project to the benefits chart:
From the Home page, navigate to Project Settings.
2. In the Project Details section, click the add icon (+) next to Expected Benefits.
3. Enter the relevant information, including the benefit description, success criteria, realization date, and the expected and achieved values.Click Save once done.
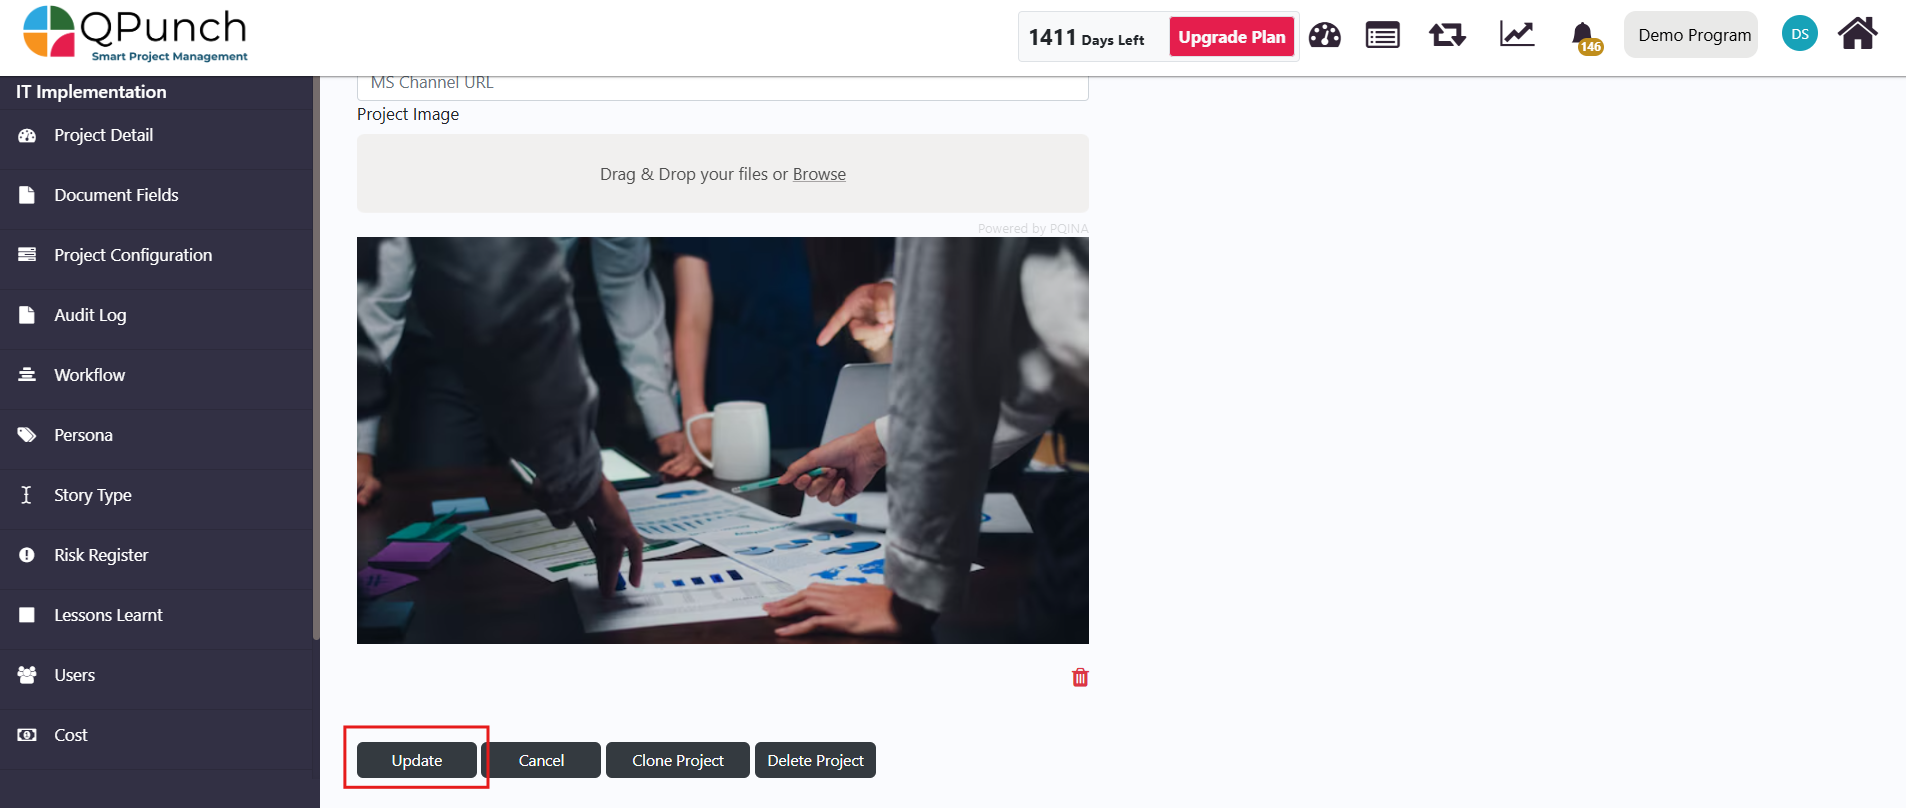
4. Then click Update to apply changes.
5. Return to the Home page and enable the Outcomes Toggle.
6. Click the Exec Report button. The newly added benefit will now be reflected on the Benefits bar chart.
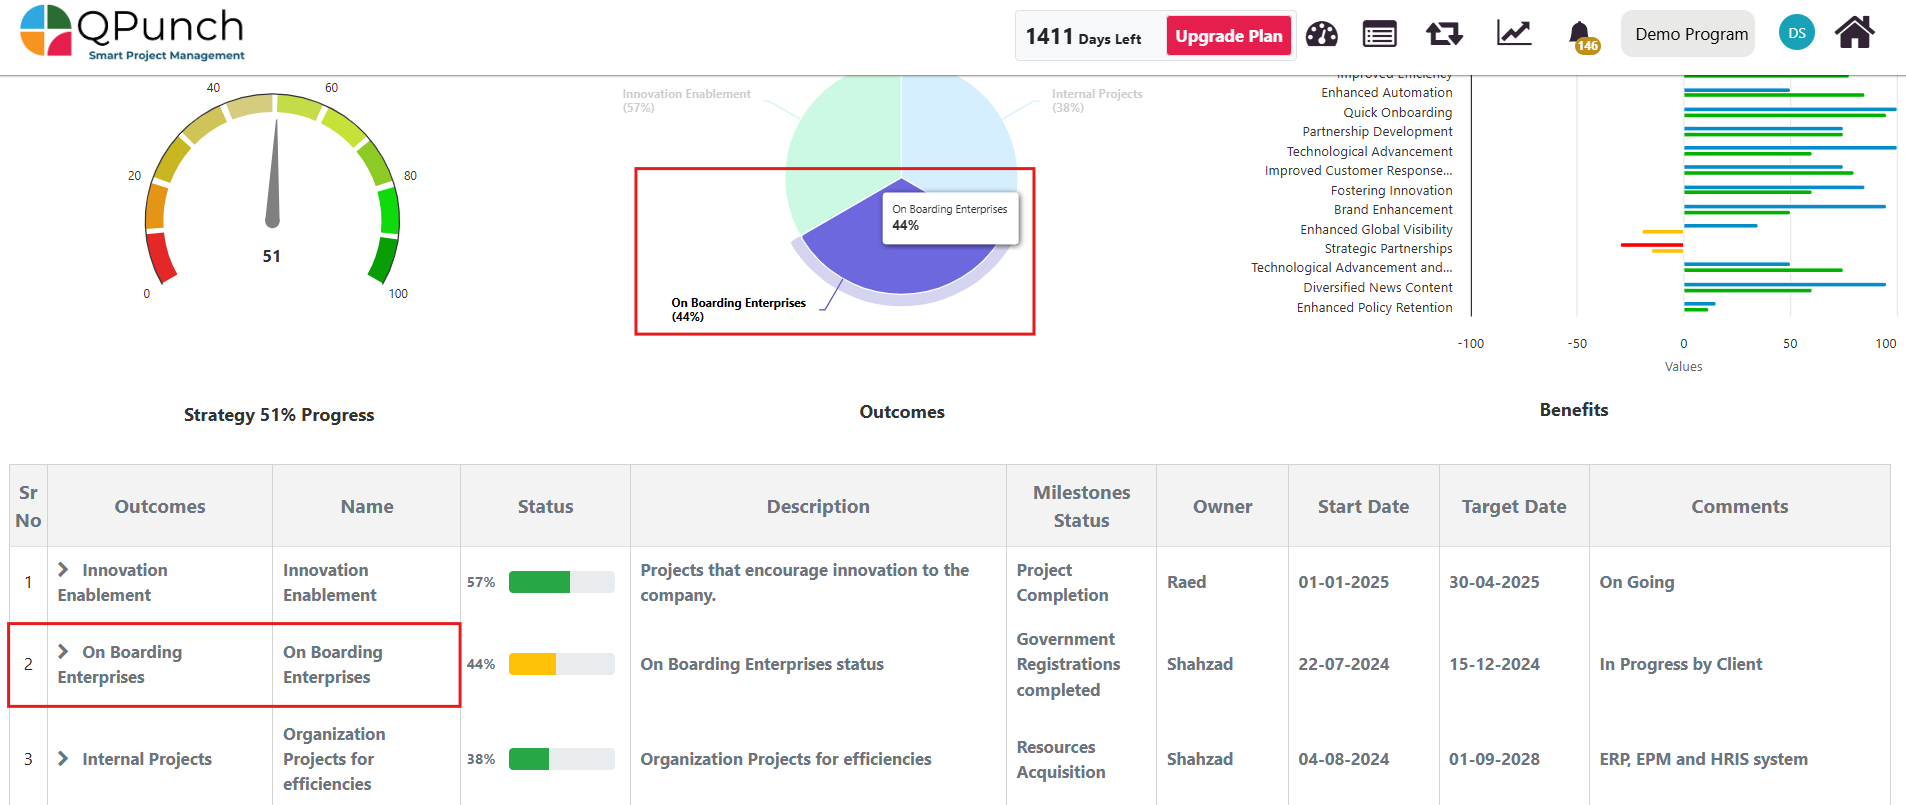
Exploring the Outcome Table:
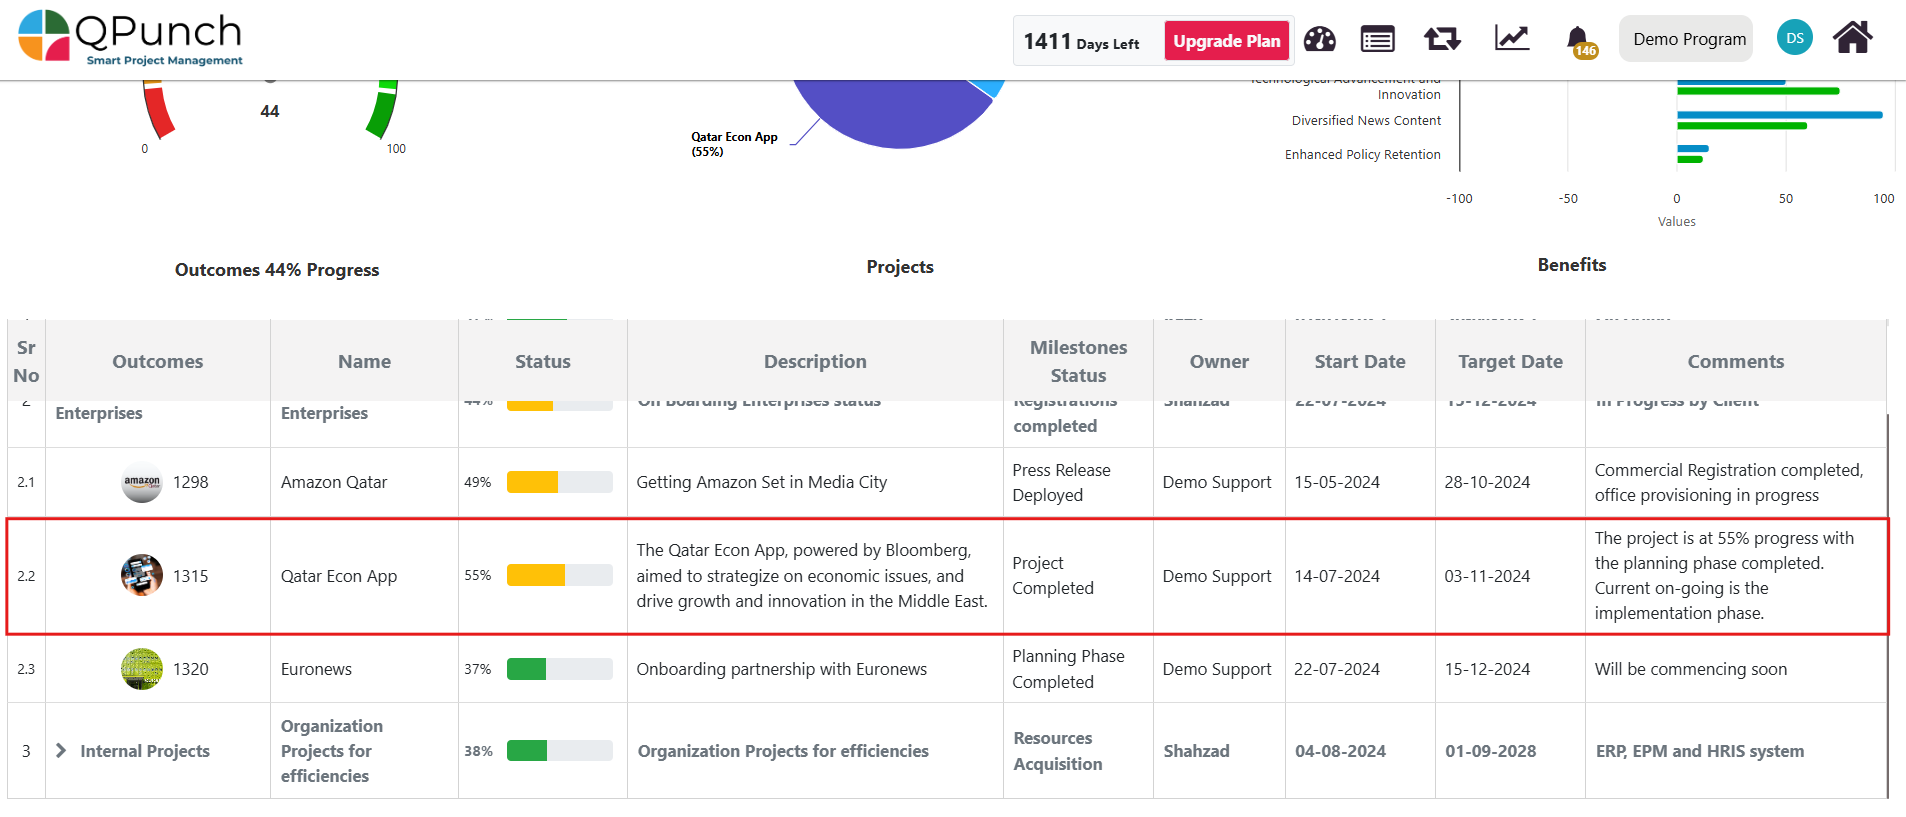
Below the charts in the Exec Report dashboard, you will find the Outcome Table, which displays a summary of outcomes along with their parent-level information.
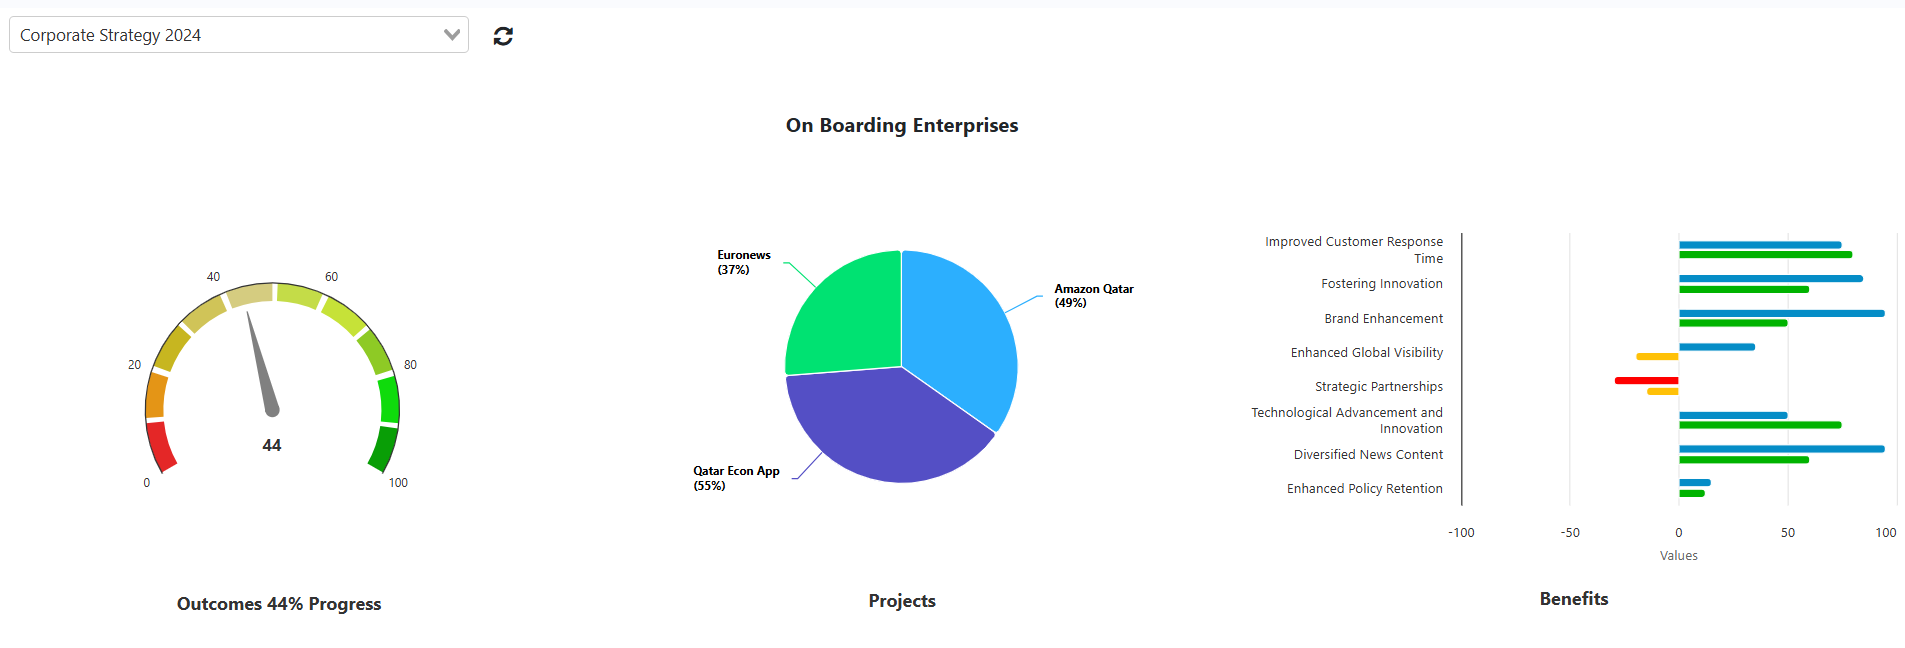
To drill down and view the projects within a specific outcome, select the outcome name from either the pie chart or the Outcome Table.
2. The outcomes progress speedometer, projects pie chart and benefits graph will dynamically adjust to show the selected outcomes relevant data.
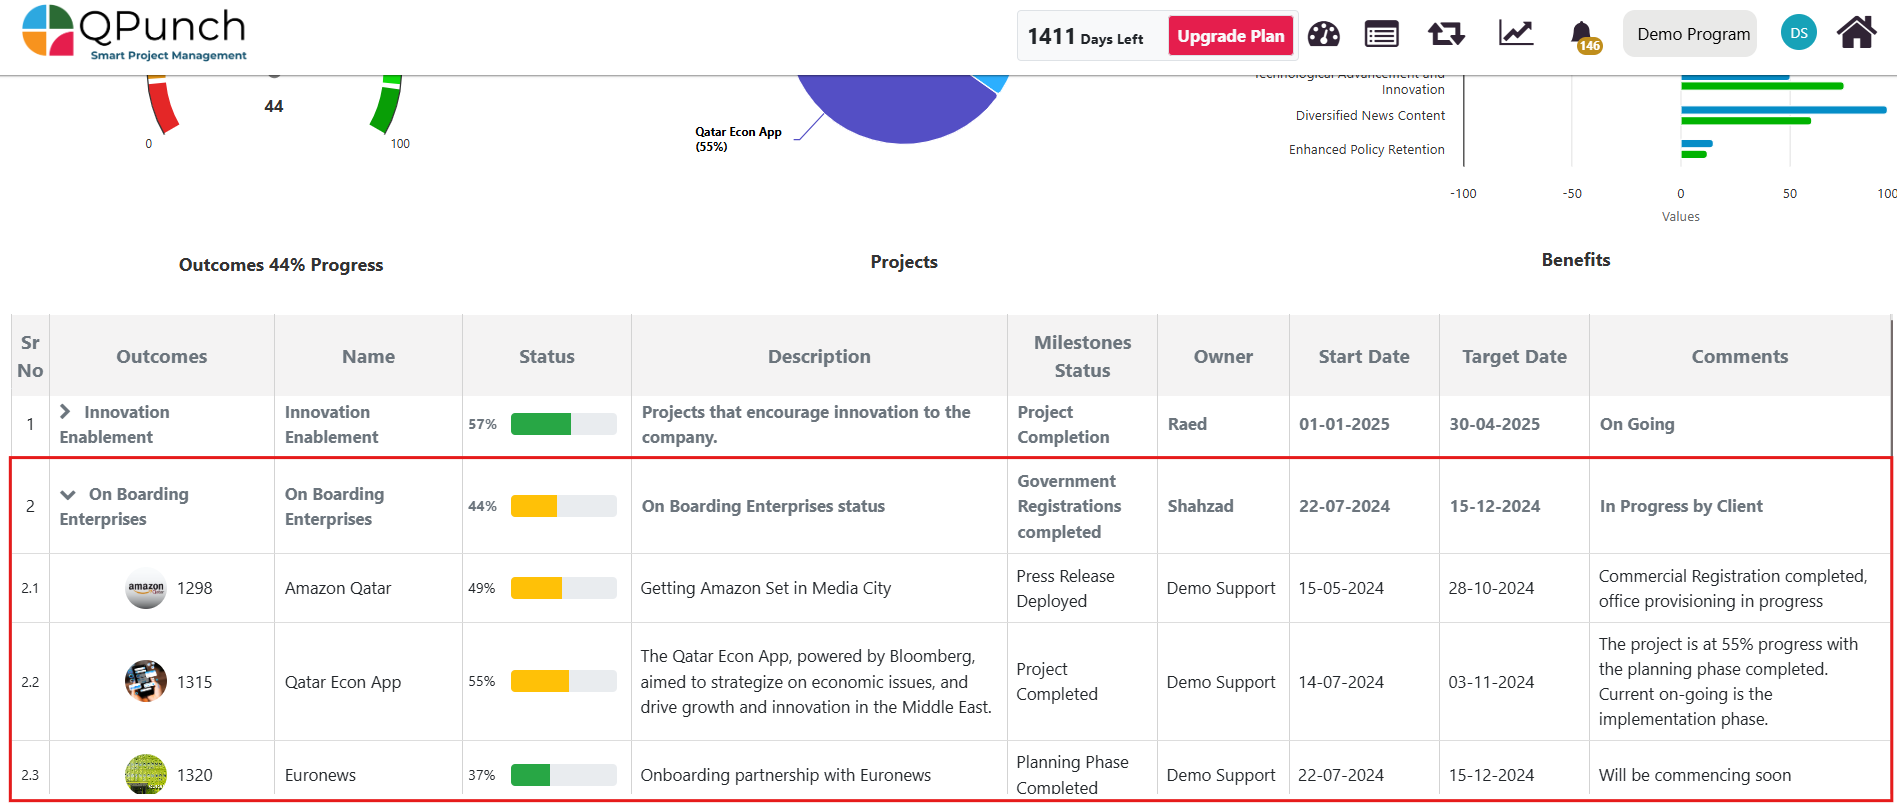
3. Scroll down to view detailed information about each project, including; Project status, Descriptions, Milestones, Owner, Start and Target dates and Comments.
4. To refresh the page, click the Refresh button at the top of the page.
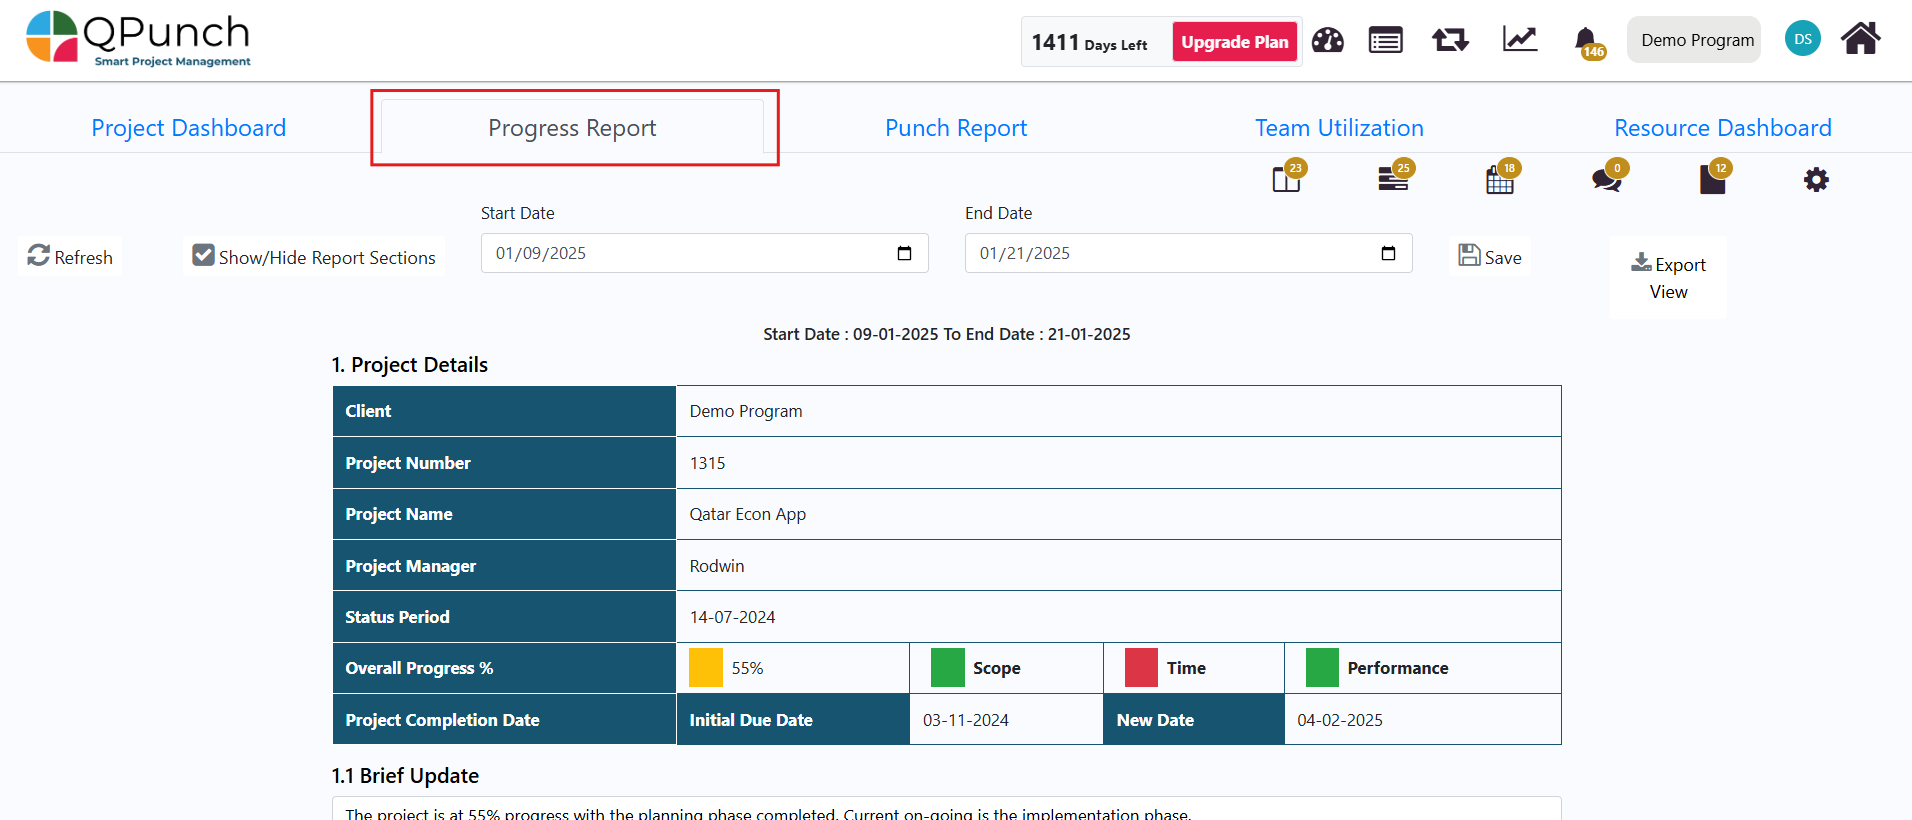
5. To view a specific project’s Progress Report, click on the corresponding row in the table.
6. The user will be redirected to the selected project’s progress report.
Conclusion:
By following the steps outlined in this guide, you will be able to efficiently utilize the Executive Report in QPunch. With the ability to create and manage outcomes, track overall progress, and add benefits to the graph, you can gain deeper insights into the health of your projects and outcomes. The flexible design of the Exec Report dashboard ensures that you can access the information you need immediately, making it an essential tool for higher managers tracking and managing the company’s projects’ success.