Smart City Implementation

Problem Statement
One of the major Smart City development Project had a challenging requirement to collaborate effectively between multiple site contractors and then get all their relevant component’s I/O details into a central system.
This development project had around 110 buildings in different sites. Each of this building had multiple ELV systems like CCTV, Access Control, Fire Alarms etc. from different brands and types. Moreover, there were many contractors working in every building, and the coordination between them was crucial to ensure right set of input / output data is provided for the central system to Go-live efficiently.
Pain area was that the whole thing was unorganized and there was huge lack of communication between the contractors. Management was doing daily meetings to organize the synchronization but there were lots of efforts required to have an appropriate alignment. They were using manual excel sheets to follow-up, track and monitor the progress over the data fed in the central system. Later, the project milestones started getting missed out which made the situation highly complex for the client to manage stakeholder’s expectations and overall deadlines.
Requirements:
- Centralized cloud based SAAS platform
- Intuitive and user-friendly interface for easy adoption.
- Transparency of the work between all parties.
- Customization based on the unique requirements of the business.
- Improvement in the collaboration of the site contractors.
Solution:
They started working with our team to discuss their pain areas and explain all the requirements which were clearly documented with several sessions to understand and optimize the work process first. Based on the requirements understanding, the team then customized and created a proof of concept based on our QPunch application. The POC was presented and fine tuned to perfectly match the business process which would effectively manage the data correction process and collaboration between the contractors.
Finally, their entire team got onboarded and a significant portion of the company and contractors were using QPunch to collaborate and track their progress and data inputs. All communications and follow-ups started commencing inside the platform seamlessly. They maintained data collection and data rollout on the digital boards enabled by QPunch. This way they were able to have the history and all data communication in one place. Management was able to track easily overall progress on data collection, correction, go live and these updates were accessed anytime and anywhere.
Solution Customization to fit the requirements
From the feedbacks, the system was further configured for additional tables, user friendly interface to ensure all business requirements were successfully implemented. We organized all the client projects in a simple manner with configurable dashboards. There are around 110 buildings. We have divided it into different phases. Each phase has their set of buildings.
There are many contractors working in each building, and they had to coordinate with each other’s work. They collected the input / output data and punched the data in the QPunch. We have maintained a data collection table. So, this table can be used to provide reports. The contractors collect the data first then they review the data, then there will be a correction based on the review. Once the correction is done there will be asset generation and asset mapping for each device. So, we developed an interface which helps to keep punching the data and collaborate with the central system and fetch the data which are in correction and review.

We brought different phases in an easy drop-down menu where users can switch between the phases and work on different set of data smoothly. If we select a particular phase, it will have the collection and roll out of each building as a different project in the dashboard.
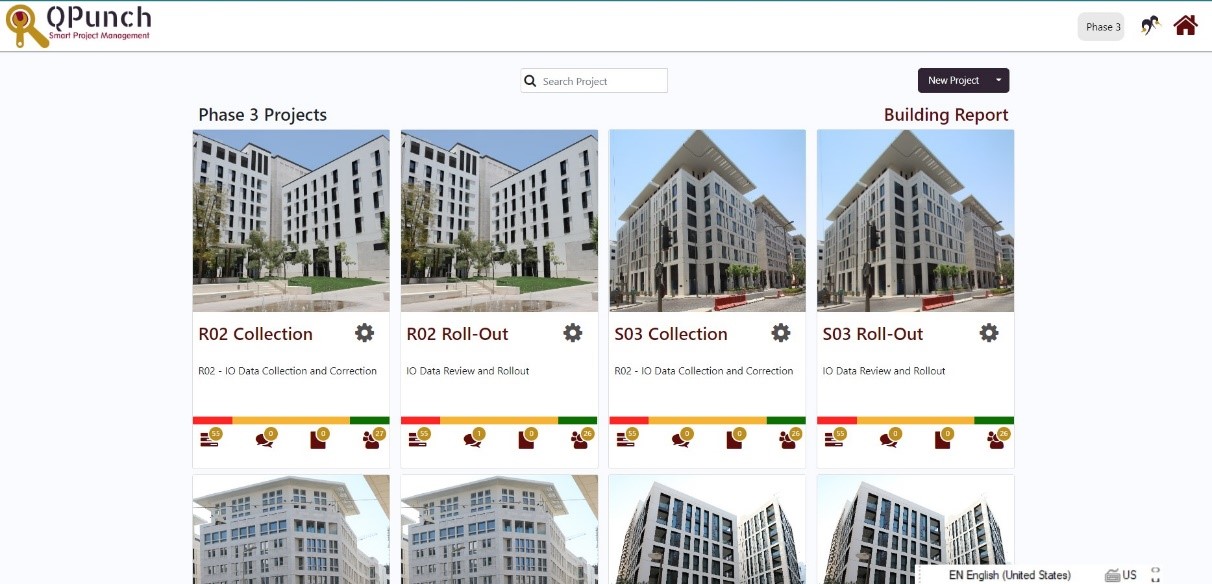
The above image is a screenshot of the one of the project’s phases. In this, RO2 is one of the buildings. Its collection and roll out is maintained as different data sets to further organize and ensure we are monitoring the right set of data. Similarly, they have different buildings and their collections and roll outs are maintained separately.
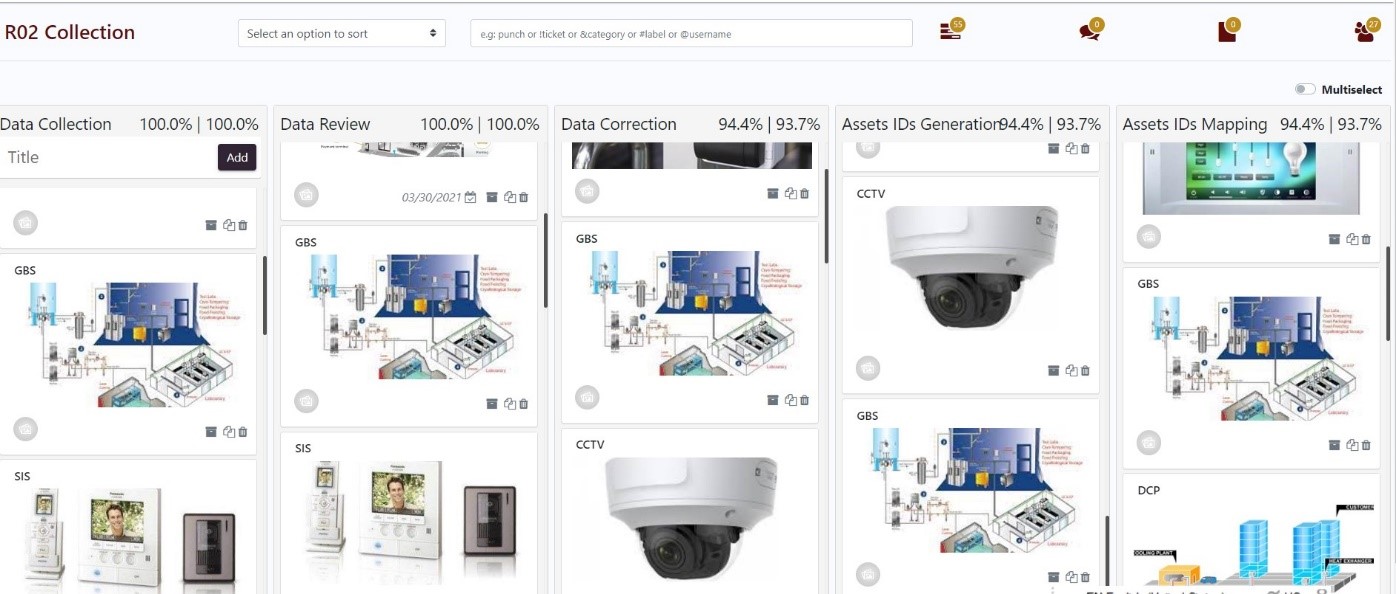
This is a digital board view of RO2 Collection project. They have a fixed number of tasks in each lane. Each task is a security system such as CCTV, SIS, GBS etc. Each security system task is repeated in every swim lane. These lanes in the Kanban board shows what status of the data collection, review and verification we are currently in.
For example, GBS is present in all swim lanes such as Data Collection, Data Review, Data Correction, Asset IDs Generation, Asset IDs Mapping to update the data in different stages.

Each task maintains a table inside it for the data collection. For the 1st pass of data collection contractors visits the site. They go to the site multiple times and keep collecting the asset data. We customized this table mainly for them to do this collection process and correction process effectively.
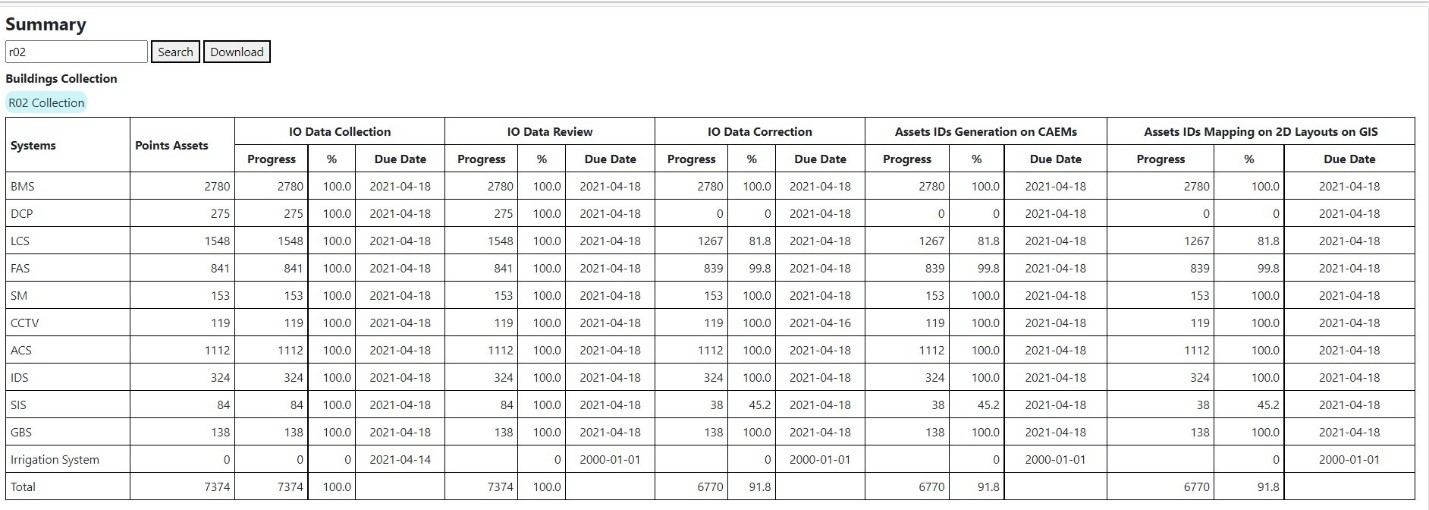
Our system was generating live management reports that showed the accumulated view of overall data collection and how many points are there and what is the progress at present and what is the percentage of progress.
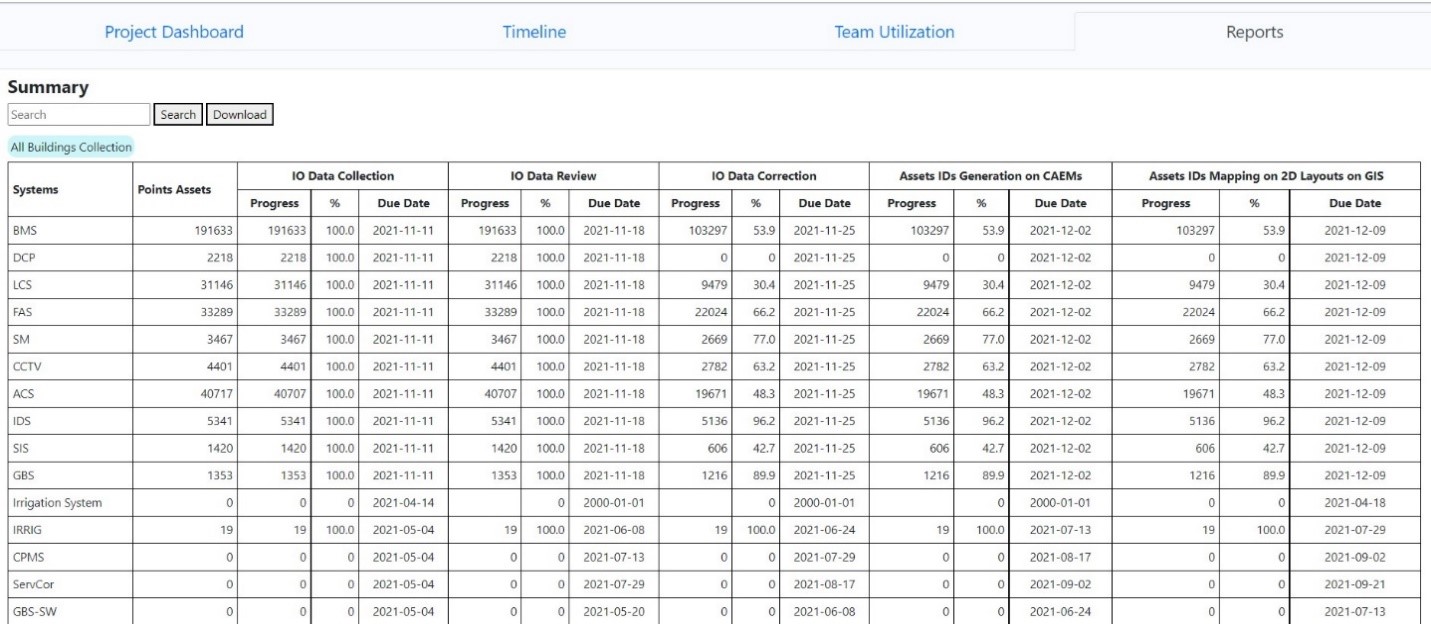
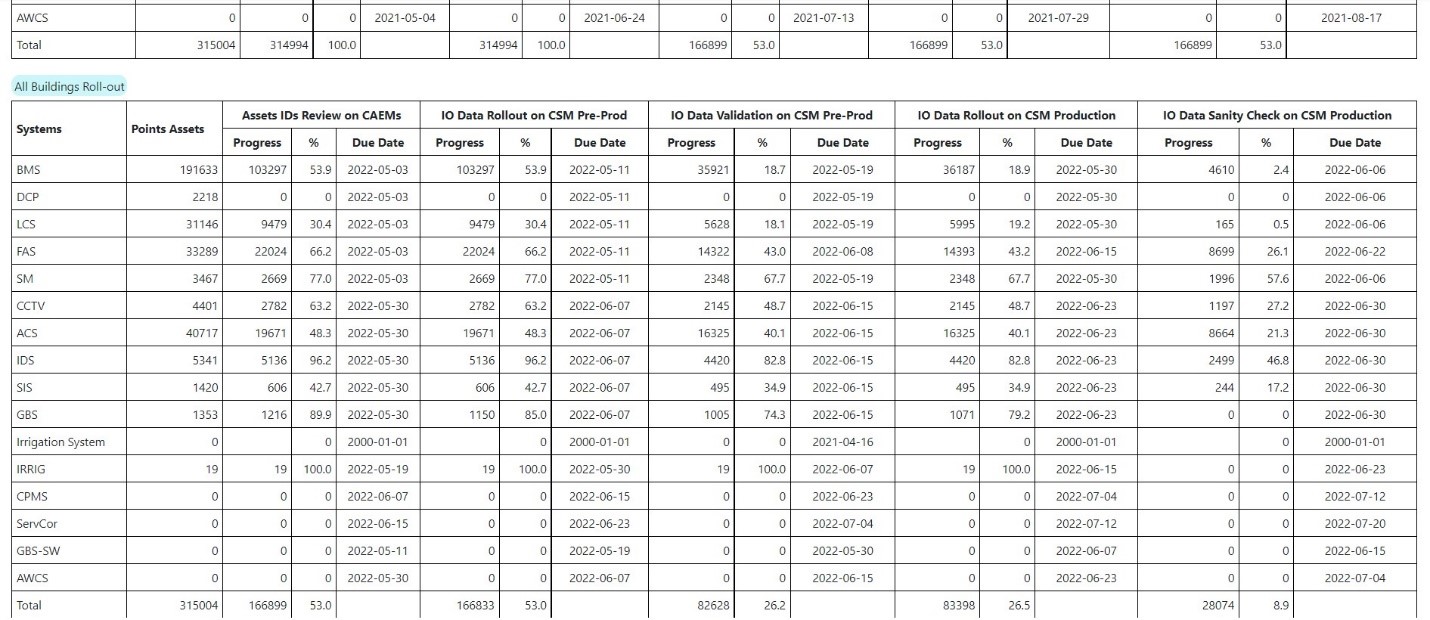
Management had the capability to easily search a particular building name and it shows the report of a specific building. In this we searched for the building RO2. It shows all the tasks, and their details present in the RO2 collection and RO2 roll out.
This is another phase called Site Wide. It had data sets to populate and completion for all the building external system which are common all over the full site such as car parking, Automatic waste collection system etc.
Address On Maps
Ready To Get Started with Smart Project Management?
