Informative Dashboard
Informative Dashboards
Real-time visualizations using our product take guesswork out of the picture, and managers/executives do not need to rely on manually recorded measurements. Using live dashboards, you can view all project activities instantly as it is happening.
Executive Report
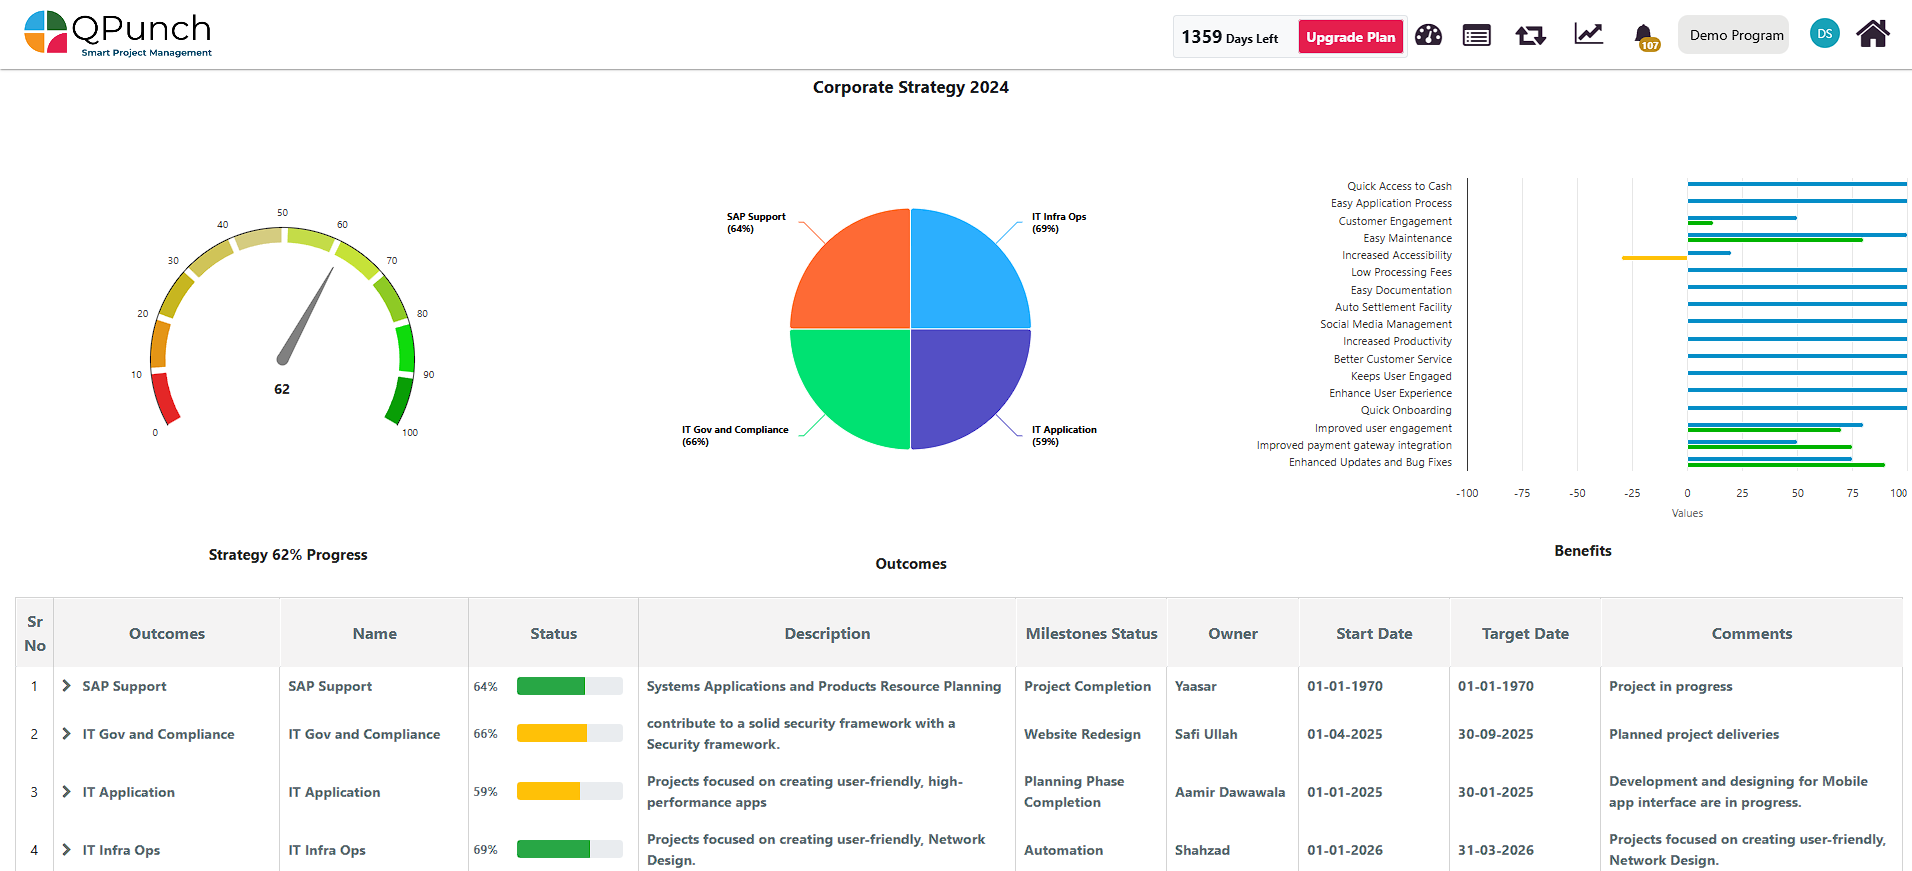
- The executive report is the high-level report for the senior executives, which provides a comprehensive overview of project outcomes and progress in a single view. It allows the stakeholders to track the status, benefits, milestones, and other fields of various projects and make informed decisions. The report provides the opportunity to drill down to each program or portfolio using highly interactive charts, which can be customized based on user requirements.
Progress Status Report
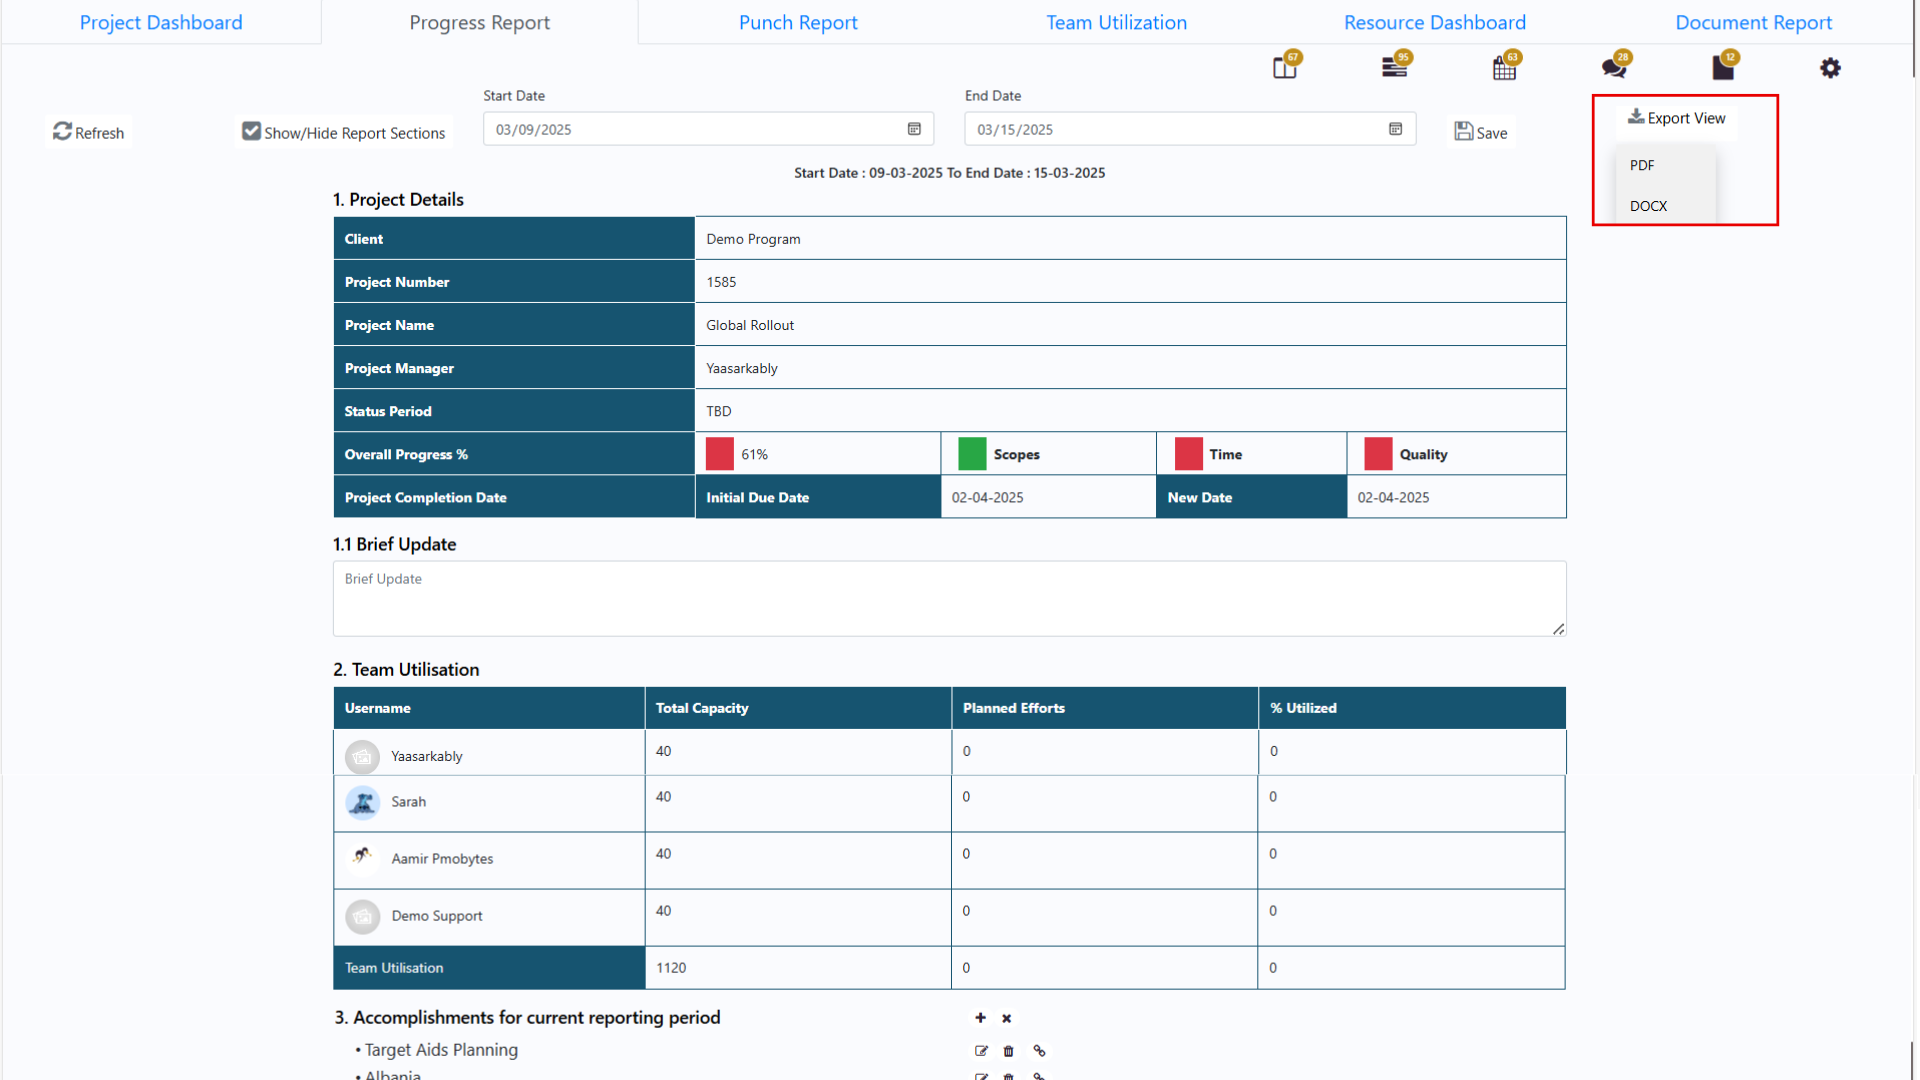
- Progress Report helps track team progress, manage tasks, risks and issues and customize reports. Users can adjust the reporting period, update RAG status for Scope, Time, and Quality, and modify the overall progress colour. The report layout is flexible, allowing sections to be shown, hidden, or added as needed.
QPunch’s Reports provide real-time insights, helping teams track the progress of projects, programs, and portfolios and make data-driven decisions. With flexible reporting, seamless collaboration, and personalized views, teams can efficiently manage projects and improve productivity.
Overall Utilization Dashboard:
The Overall Utilization Dashboard helps assess your team’s capacity and project planning. It displays total available capacity and planned hours, allowing you to evaluate the alignment between planned work and available resources. This supports effective resource allocation and strategic decision-making, Also managers can toggle between two views:
- Based on Projects – This view starts with the projects. When you click on a project, it displays a list of users in that project, followed by their respective tasks within that project.
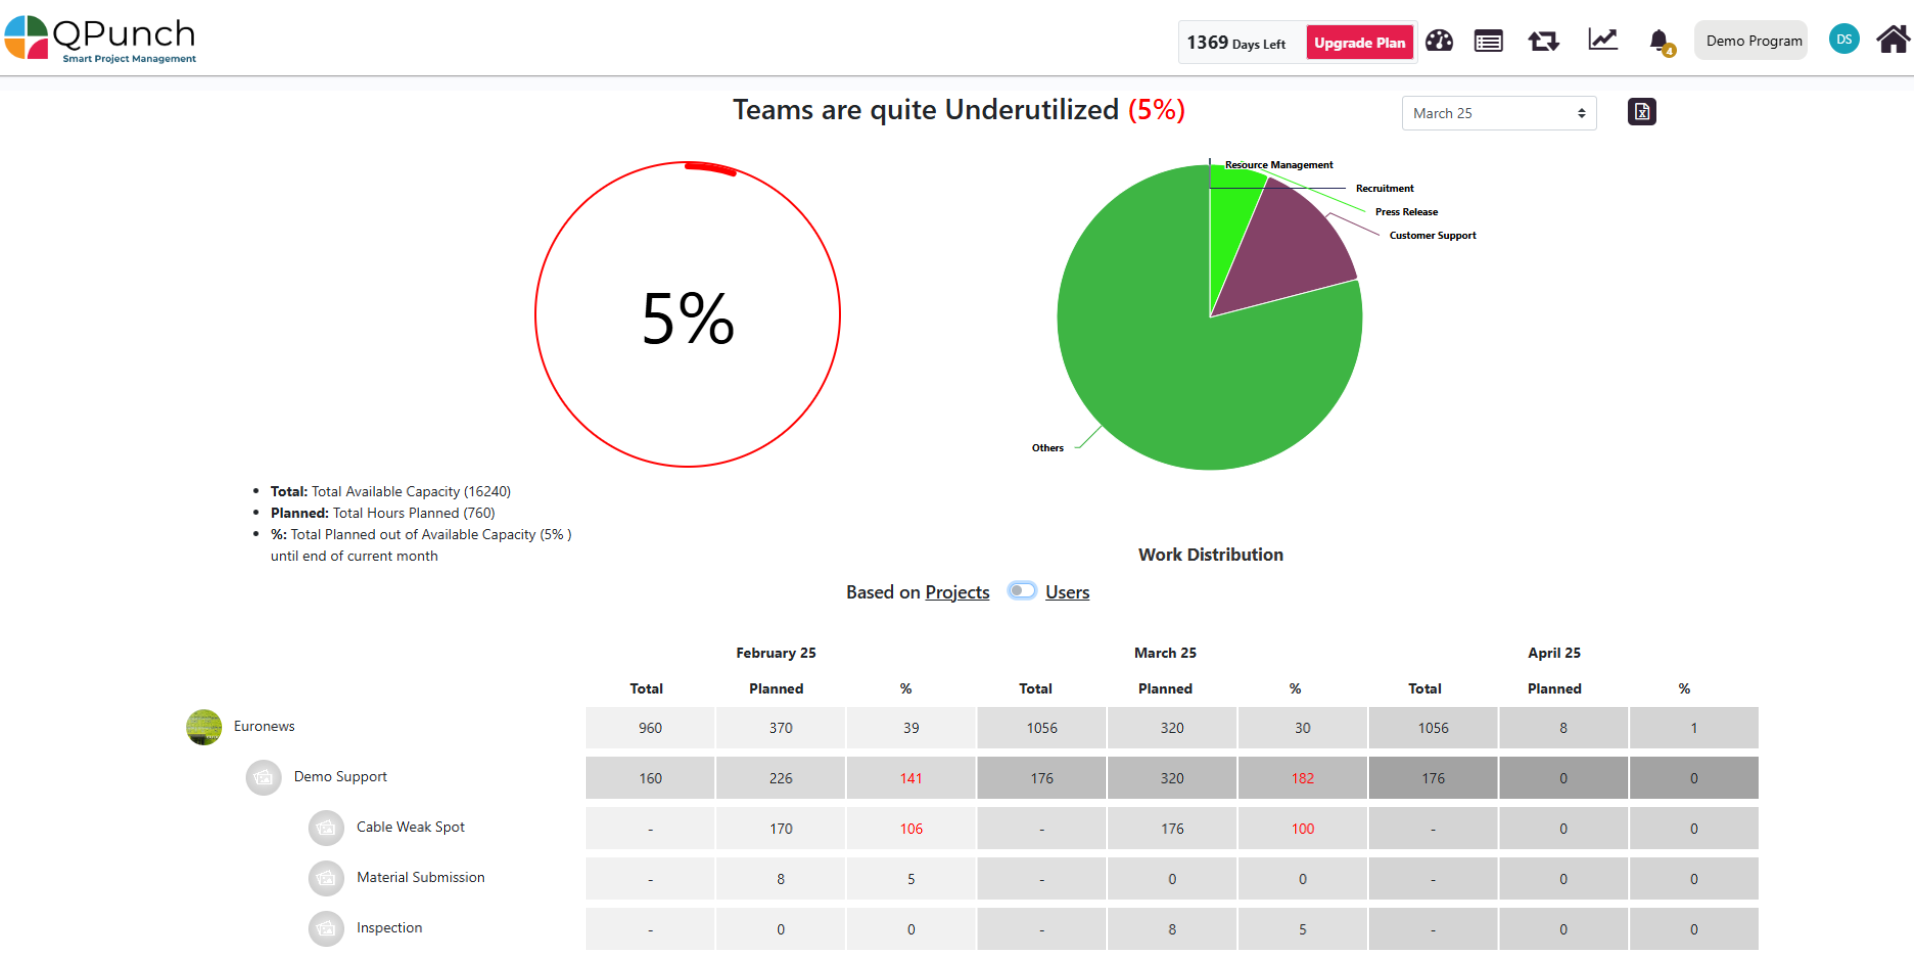
- Based on Users – This view starts with the user, then shows the projects they are involved in, and within each project, it lists the tasks assigned to them.
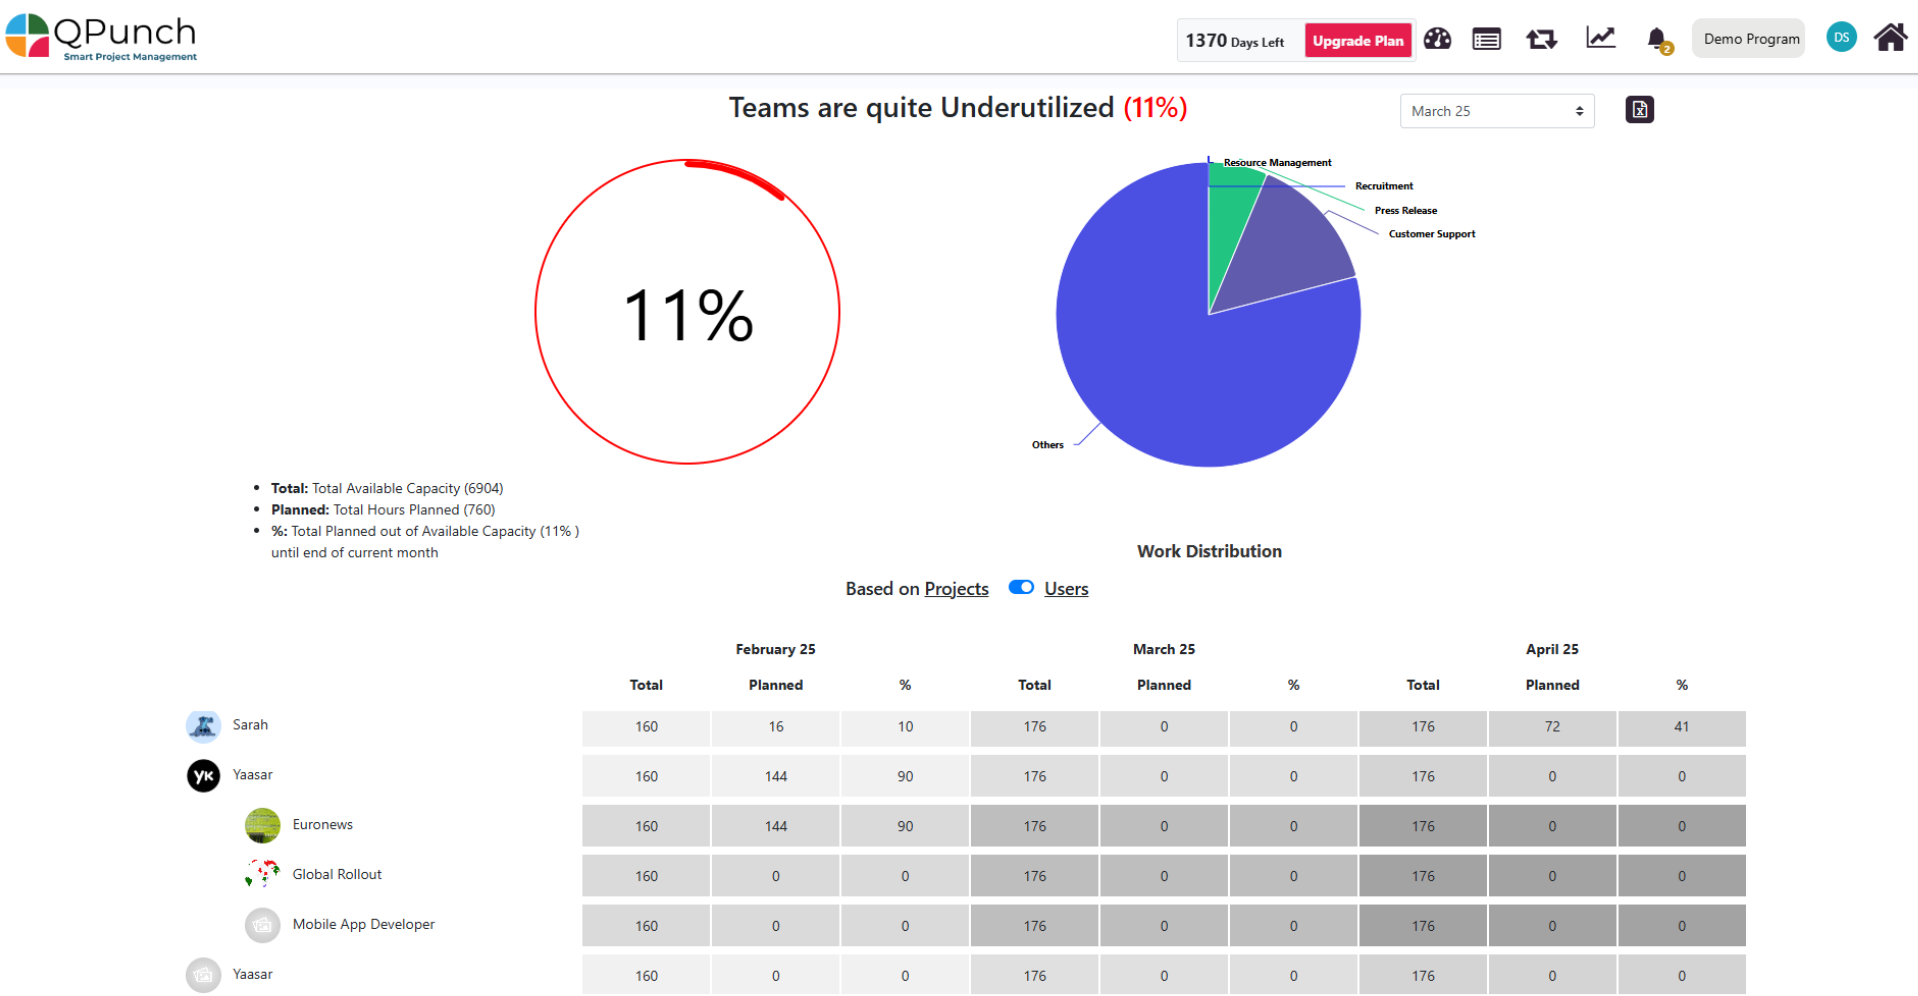
This provides flexibility to analyze resource utilization from both project-centric and user-centric perspectives.
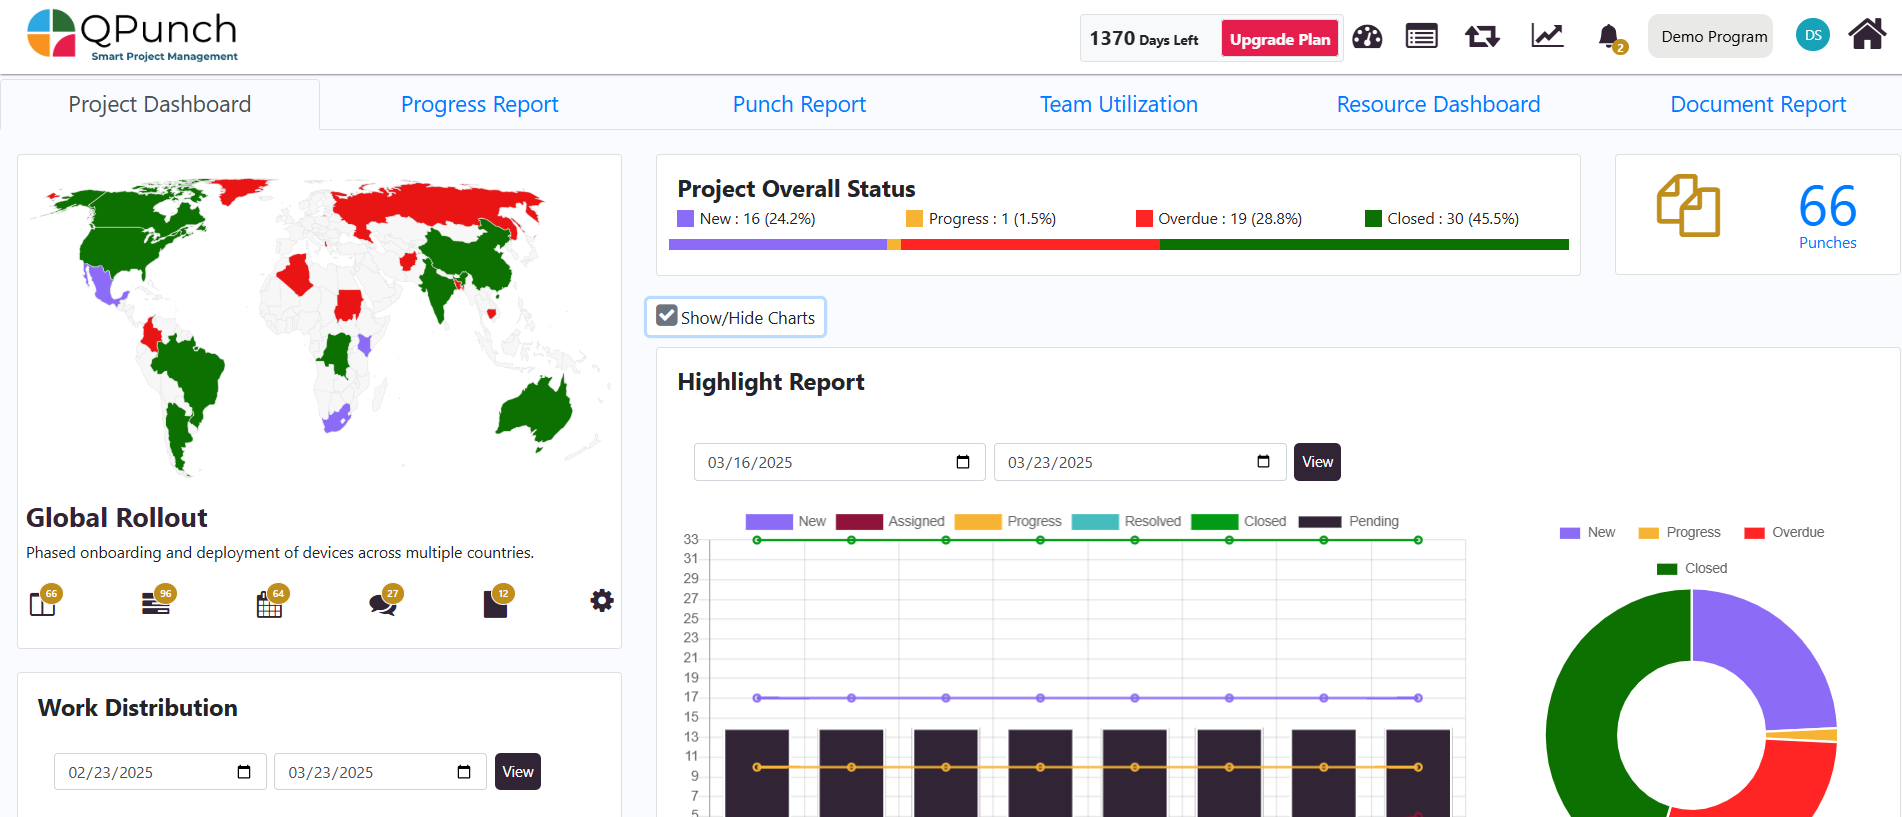
Project Dashboard:
- Utilize the Project Dashboard to get a snapshot of overall project status, project performance, achievements, and areas needing attention. This comprehensive view helps in assessing goals based on preferred time periods and adjusting strategies as needed.
Progress Report
- Progress Report helps track team progress, manage tasks, risks and issues and customize reports. Users can adjust the reporting period, update RAG status for Scope, Time, and Quality, and modify the overall progress colour. The report layout is flexible, allowing sections to be shown, hidden, or added as needed.
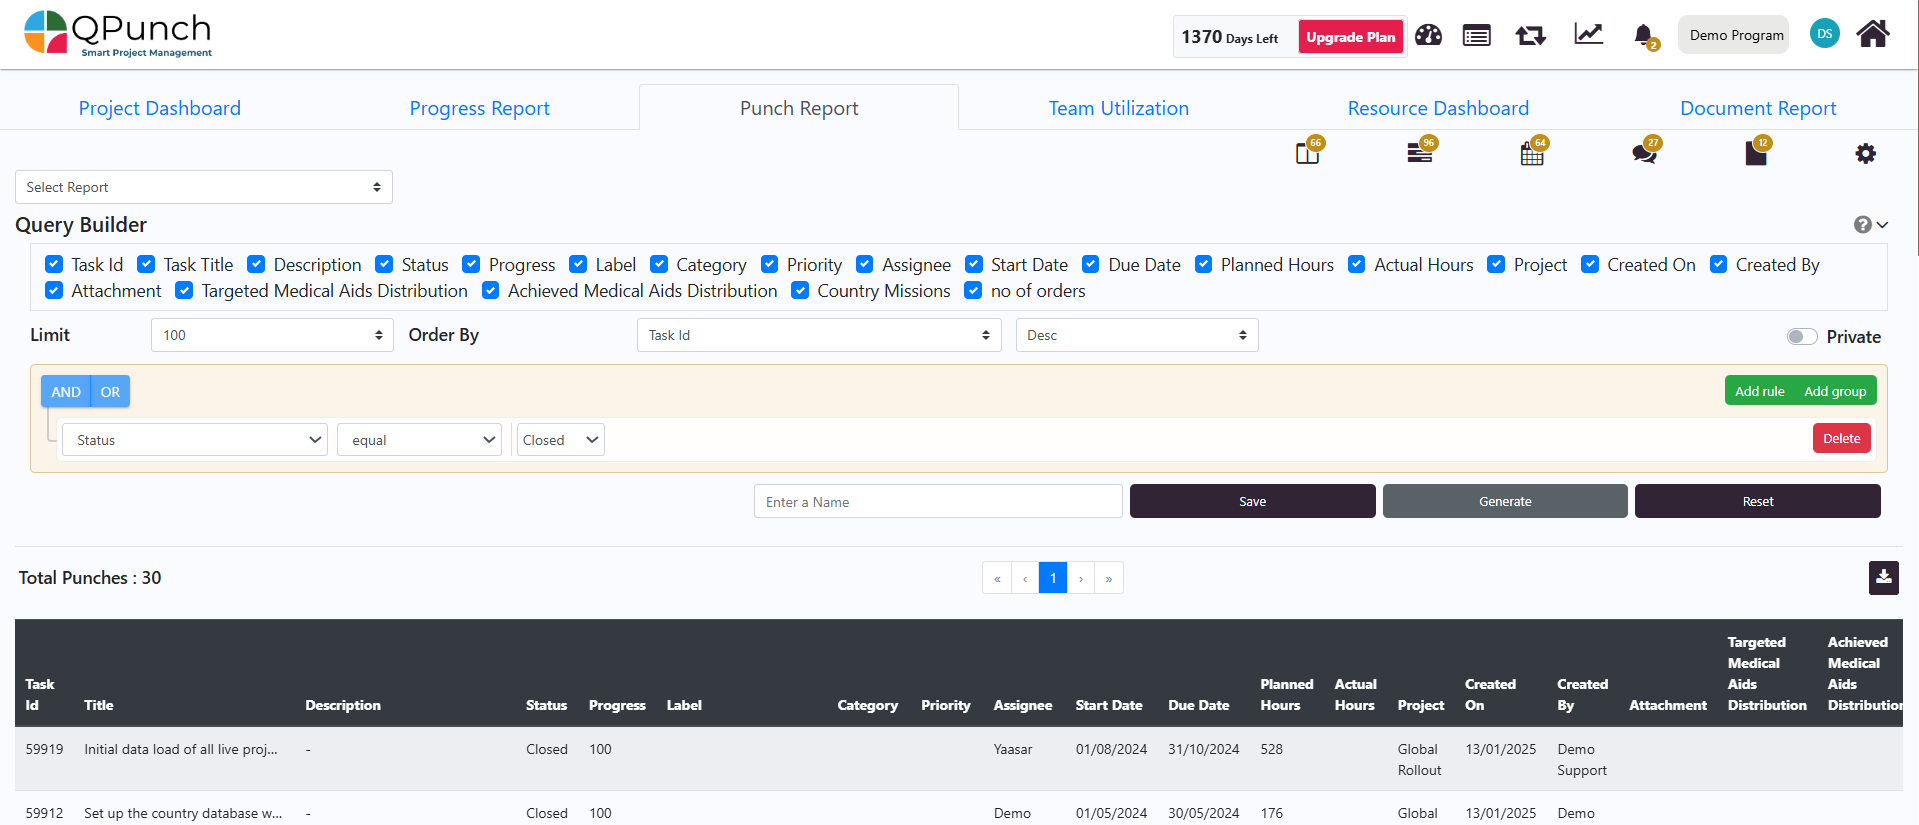
Punch Report:
- Create custom queries to filter and analyze data based on specific criteria. The Query Builder feature allows you to generate tailored reports and insights by combining various data points and metrics according to your needs.
Resource Balancing Dashboards for Optimized Productivity
Qpunch keeps your team on the same page with visual Kanban boards and facilitates effective collaboration through features like:
- Seamless Reporting: Generate reports to track progress, identify bottlenecks, and make data-driven decisions.
- Resource Balancing Dashboards: Visually see how your resources are allocated and optimize workloads to boost overall team productivity.
- Effective Collaboration: Improve communication and streamline workflows with feature like task assignment, discussions and file sharing.

User Dashboard:
The User Dashboard offers a personalized view tailored to each team member’s role and responsibilities. It provides a consolidated overview of individual tasks, weekly and monthly progress, upcoming deadlines, and overall performance metrics.

Conclusion:
QPunch’s dashboards provide real-time insights, helping teams track progress, optimize resources, and make data-driven decisions. With flexible reporting, seamless collaboration, and personalized views, teams can efficiently manage projects and improve productivity.
Address On Maps
Ready To Get Started with Smart Project Management?