Dynamic Report
Dynamic Report is a feature which will give access to the real time information, allowing user to filter the data using basic and advance data analysis. It also allows you to filter the complex reports with multi-filter functionalities.
Dynamic Report continuously updates to show the latest query results. You can use a dynamic report as any other report created using Reporting and you can add it to Performance Analytics dashboards.
Step 1:
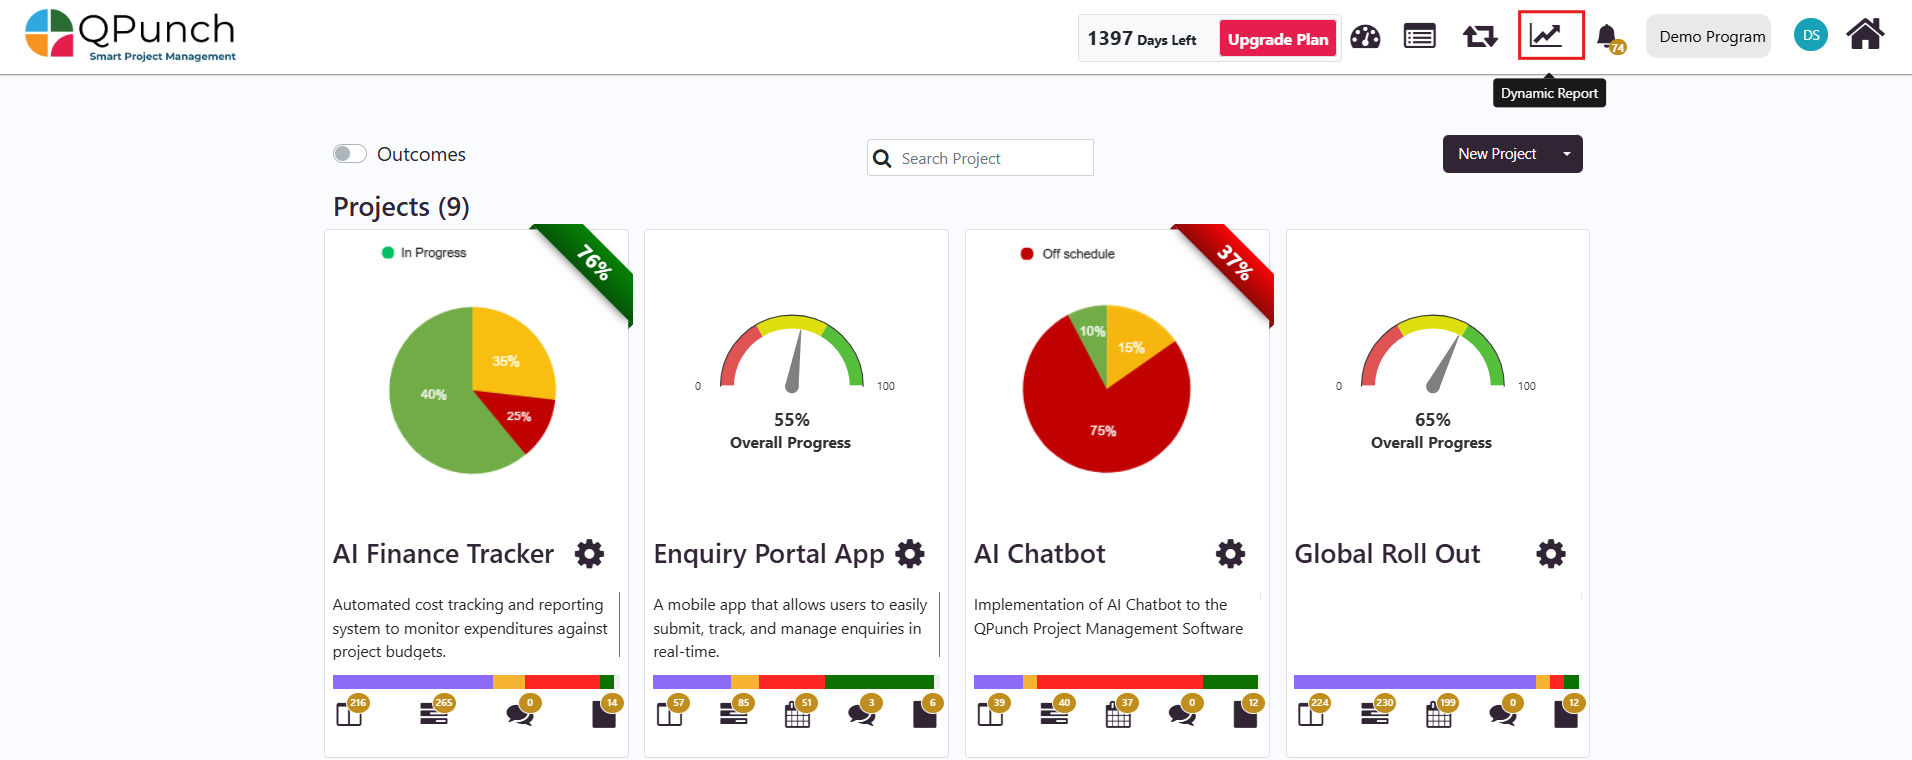
Select the above icon from the home dashboard to navigate to the Dynamic Report.
Step 2: UI of dynamic report
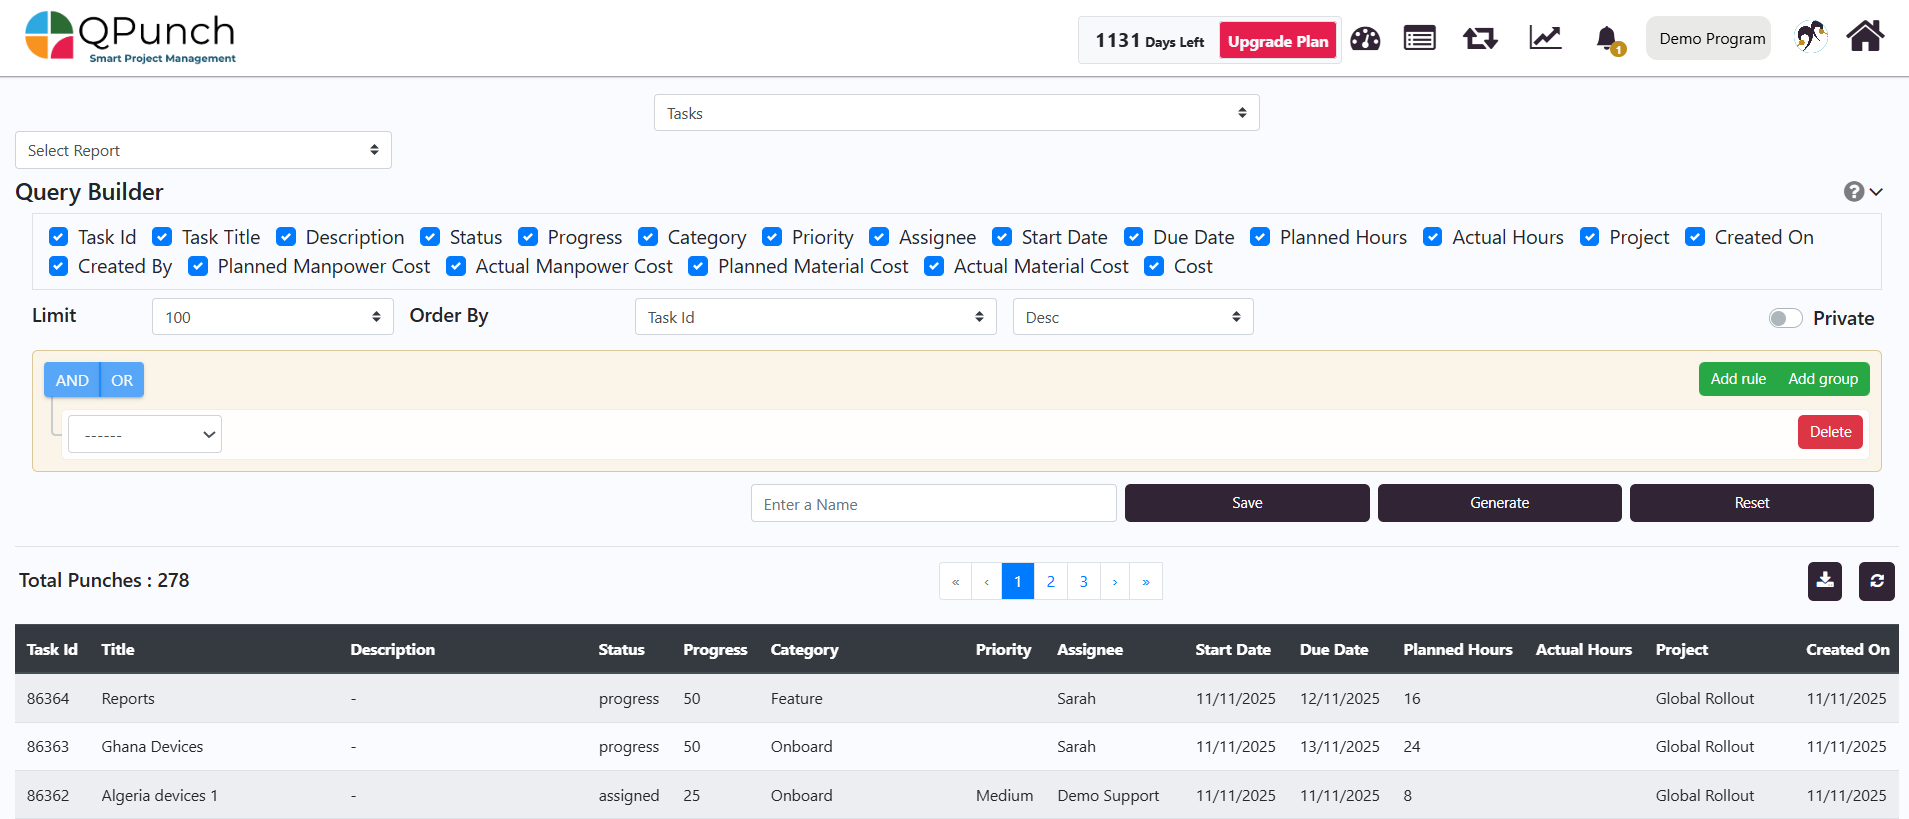
We can see every task in various projects under the subscription by default. Also, all the punch fields would be shown in the table. Recently created tasks would be displayed on the top and by default it shows the first 100 tasks.
Query Builder:
Query Builder is an UI component to create queries and filters. Using Query Builder, you can search and filter objects, select objects and columns, create relationships between objects and view formatted query results.
Basic UI Filter:

In this we have all the fields selected by default. You can disable or enable the table fields you want in the query result. After selecting it, click Generate to load all the results.
eg:
If the user wants to see only the task name, project name and Assignee of the task:

- Select only the required fields and click Generate button.
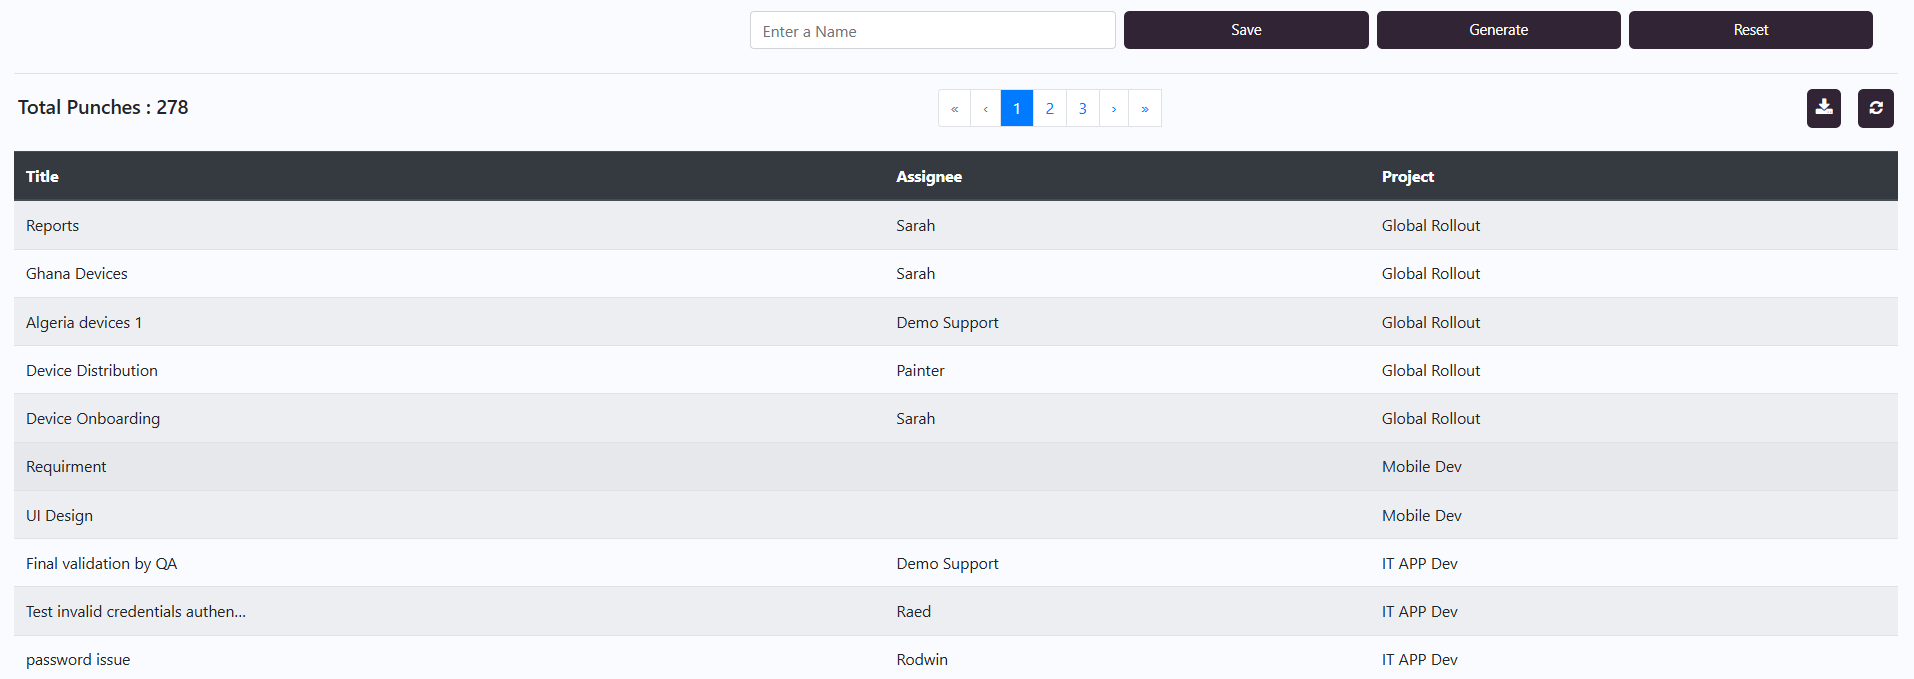
- It will display the result with respective columns selected.

- If the user wants to save the result in QPunch for future reference. He/she can enter a name for the report and click Save.
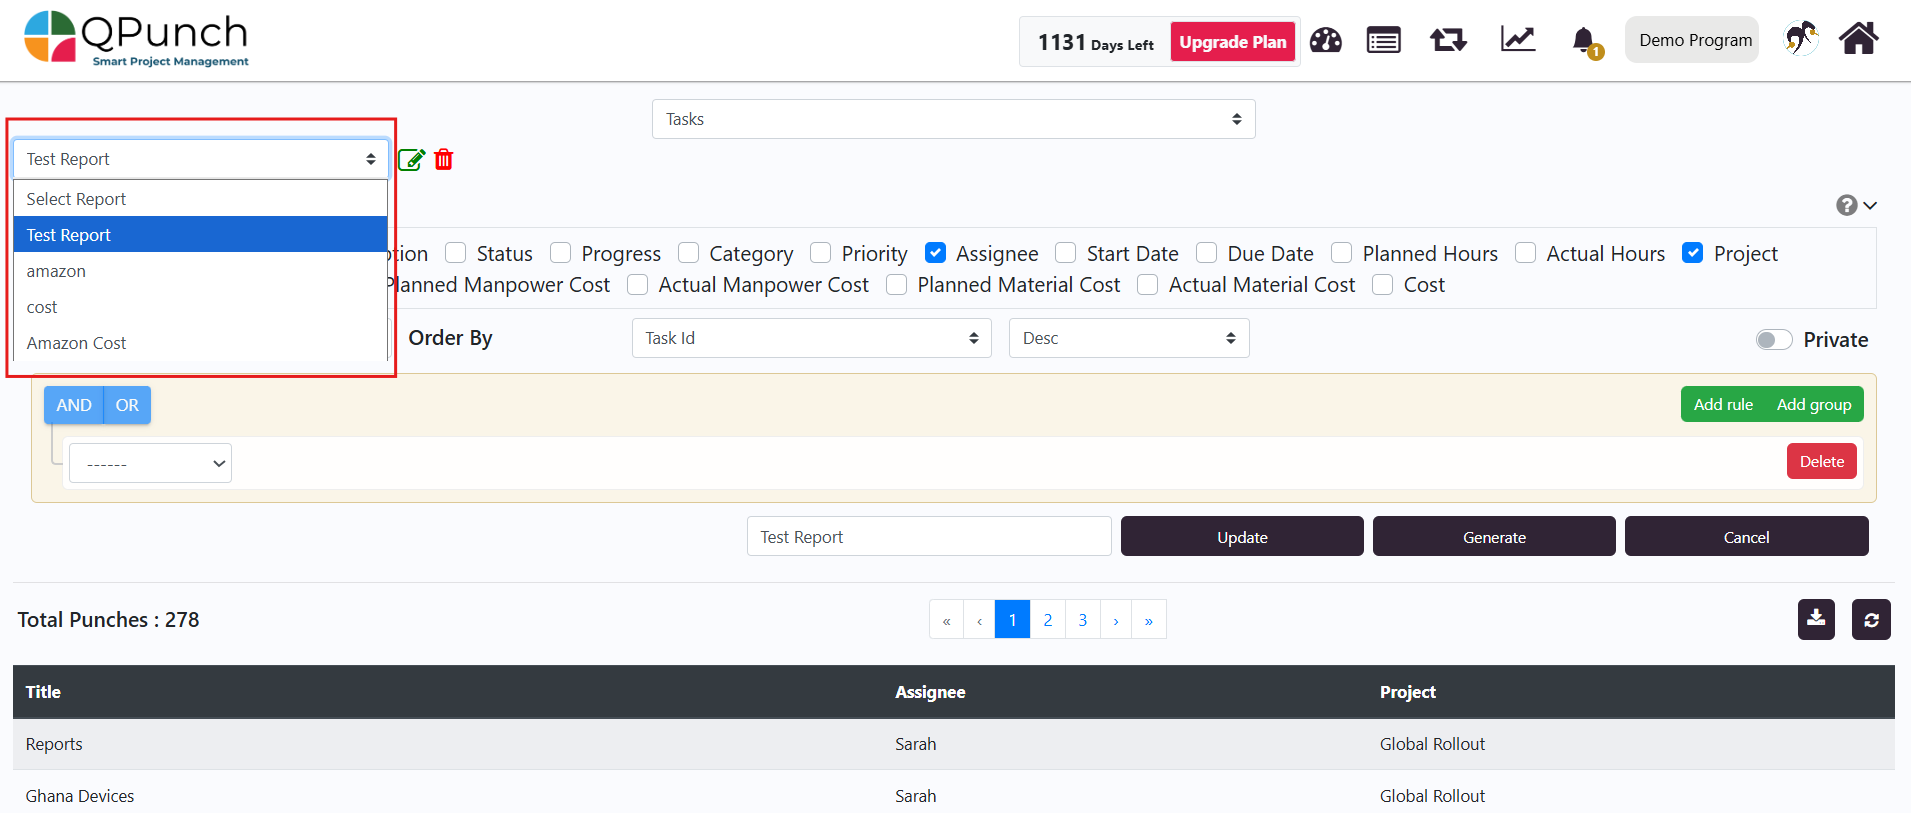
4. Click on the Select Report dropdown list to see the saved report.
Limit:
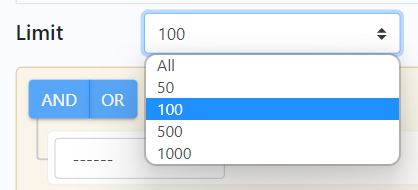
Limit shows the number of rows to be displayed in the table. By default, the number would be set to 100. If you wish to see all the tasks you can set the limit as All and click Generate to load all the results.
Order By:
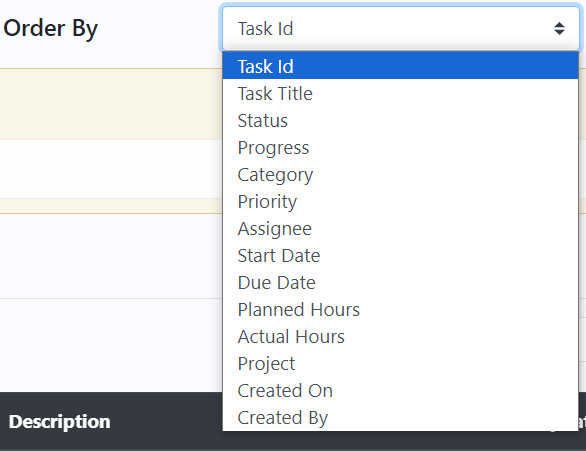
Order By helps the user to sort the respective fields in ascending or descending order.
- Select the field name to be sorted from the drop-down list.
- Select the sort option Asc / Desc based on the requirement.
- click Generate to load the results in respective order.
Advance Query Filter:

In this by default AND / OR is disabled. That’s why it is appeared to be greyed out.
- Select a field from the dropdown list.
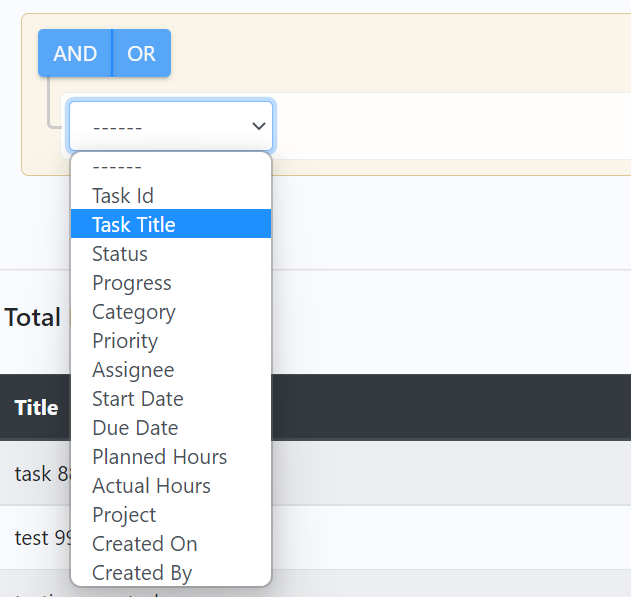
2. This will display every fields in the Basic UI Filter. Once you select the field, other two dropdown boxes appear next to it.
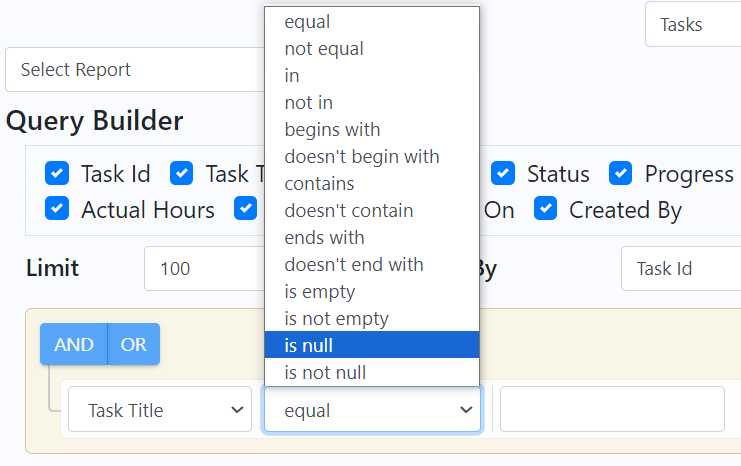
List of comparison operators in the dropdown varies based on the datatype of the field.
For eg, Task Title is a string and it has above list of operators. For Created On, it is having Date datatype and it has different set of operators to compare.
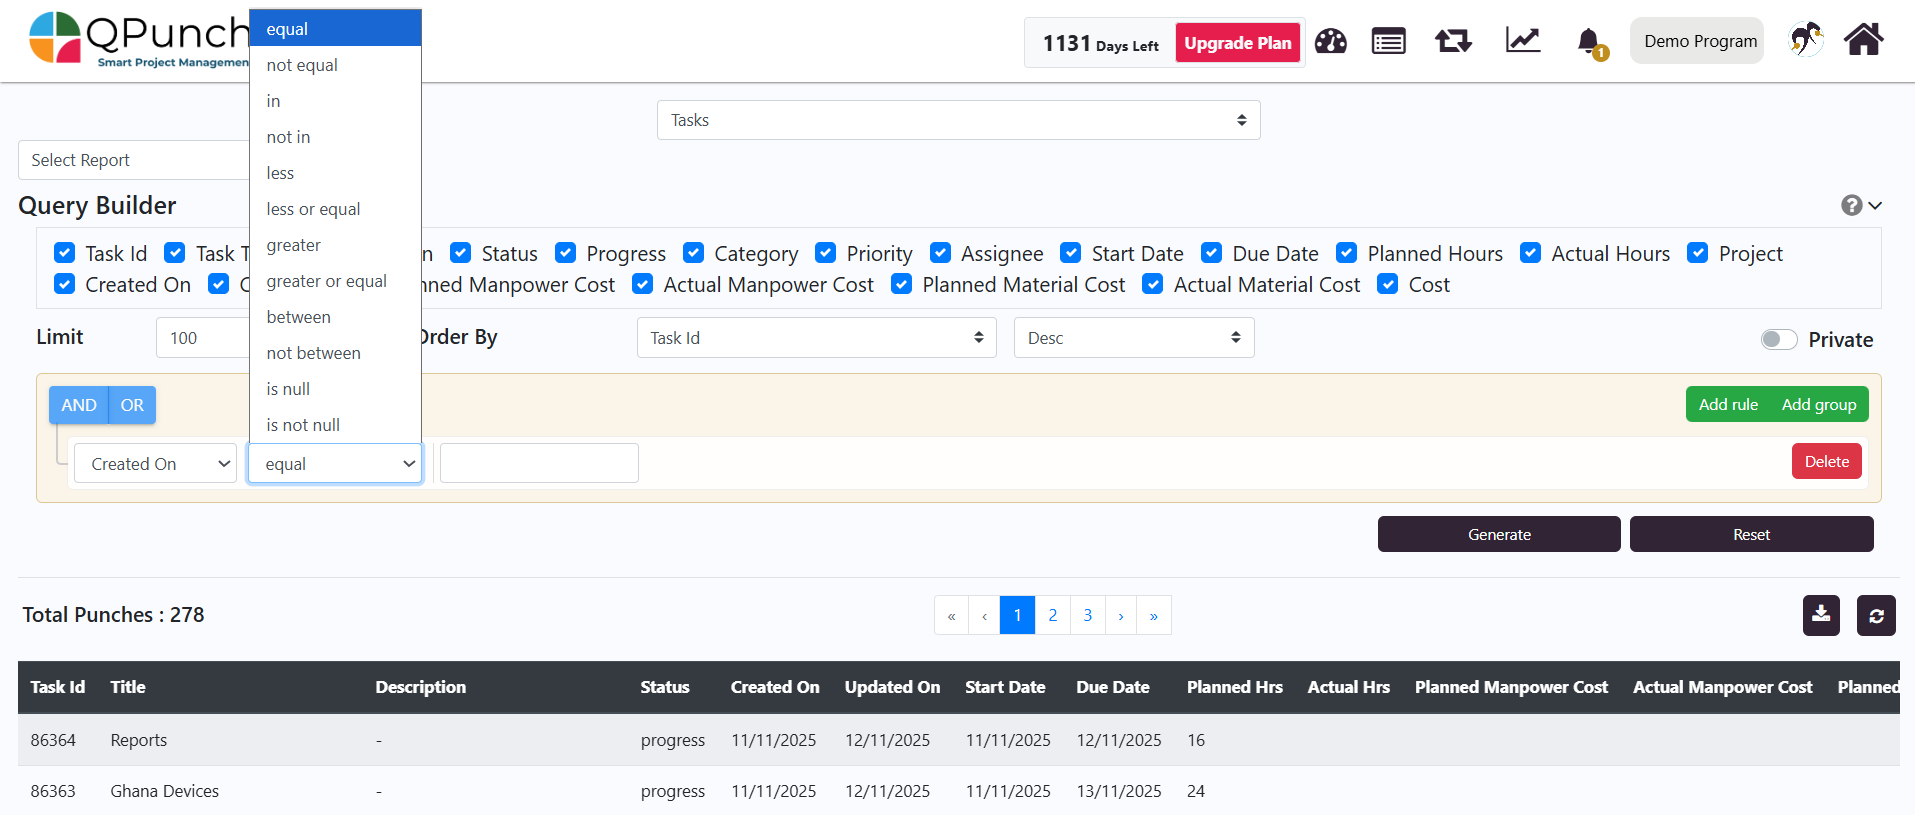
3. User can add a condition in the last box and click Generate to see the results.
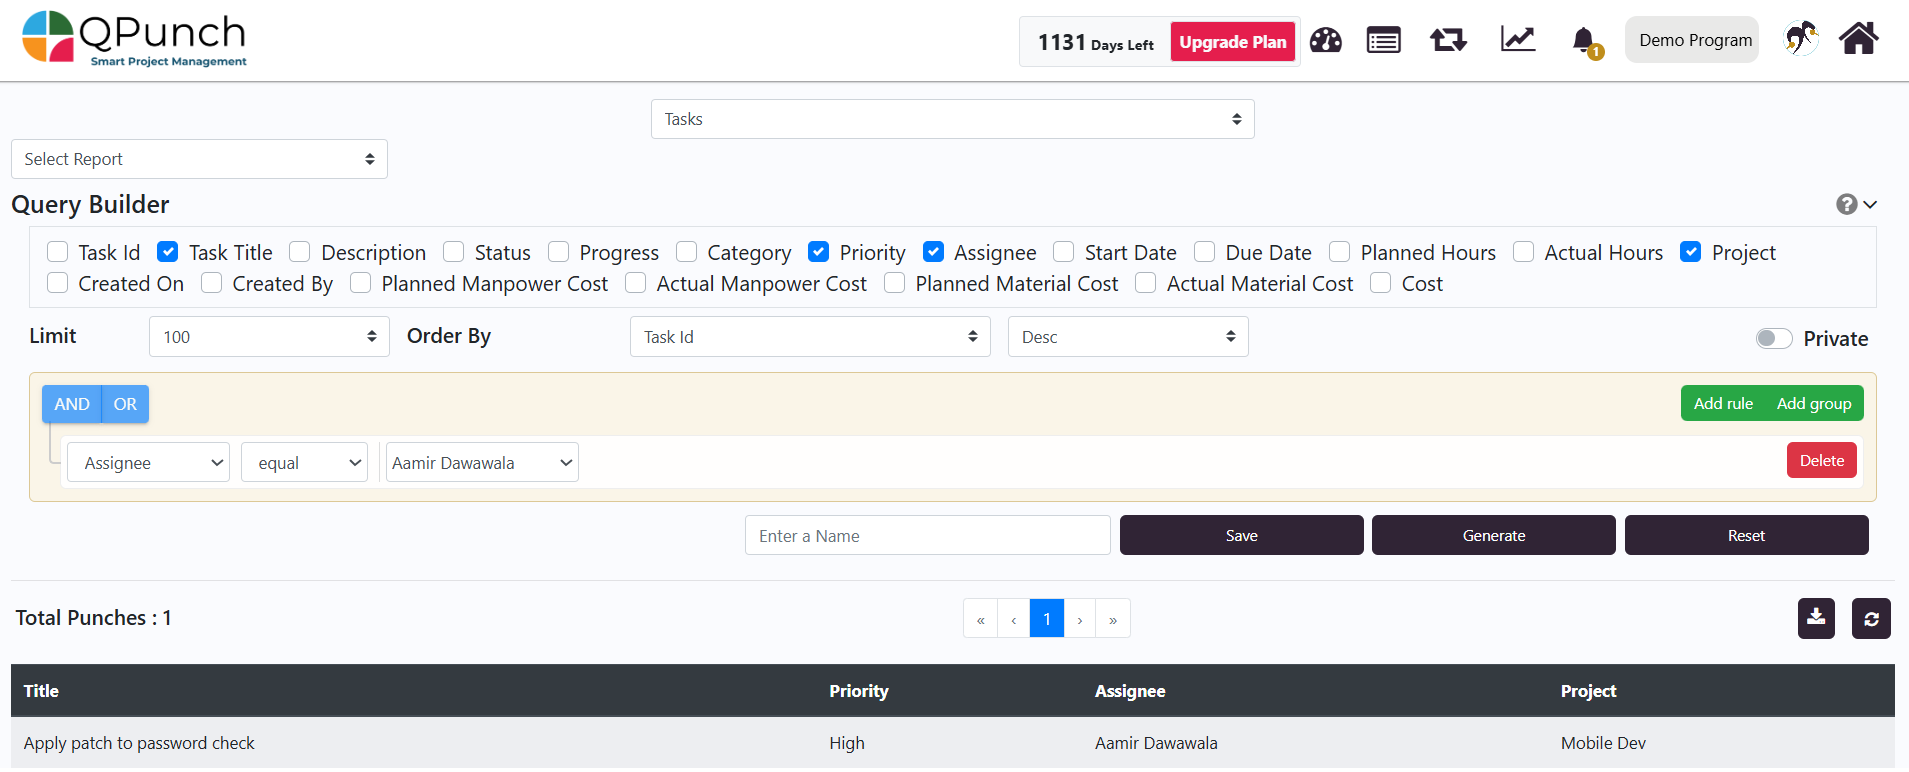
Output is generated based on the following query:
Selected fields: Task Title, Priority, Assignee, Project
Limit:100
Order By: Task Id Desc
Where Assignee = Aamir Dawawala
This result shows every task created for the Assignee Aamir Dawawala
Let’s look at few examples to understand more about the Dynamic Report:
Example 1:
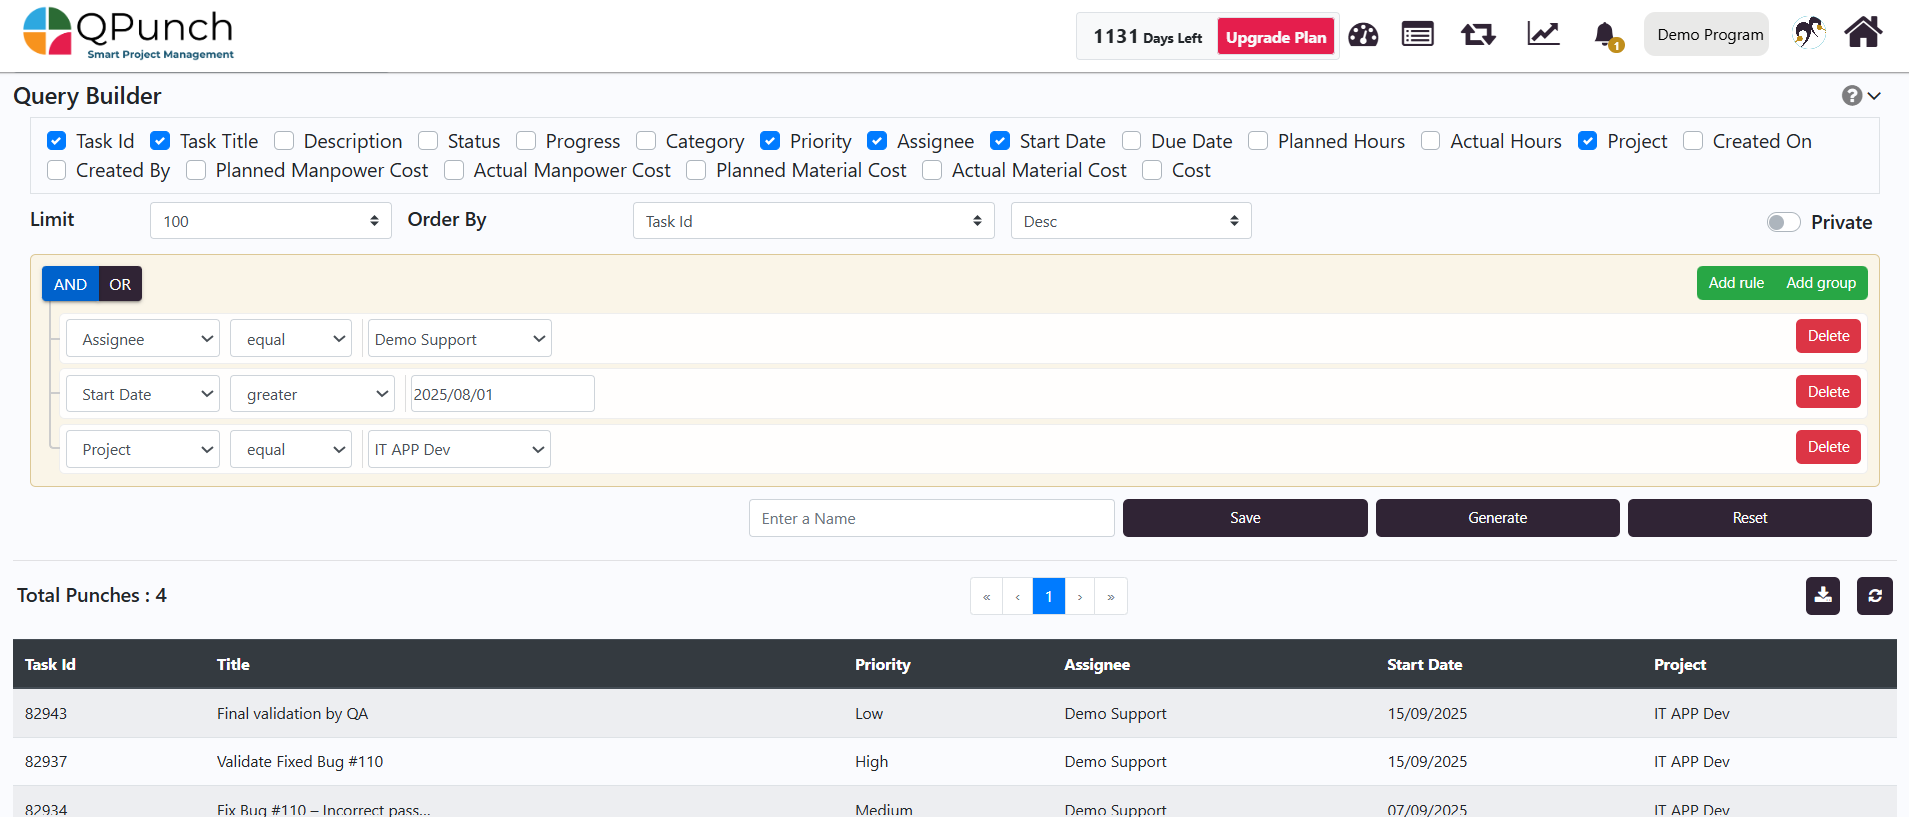
Selected fields: Task Id, Task Title, Priority, Assignee, Start Date, Project.
Where Assignee = Demo Support AND Start Date > 2025/08/01 AND Project = IT APP Dev
Note: click Add Rule to add more filters /conditions
Output generated based on the following query is:

Example 2:
- Select Add Group

2. Select Assignee = Syed

3. Select Add Rule

4. Select Project = QPunch – Dev

5. Select Add Group

6. Select Assignee = Emitta Thekkan

7. Select Add Rule

8. Select project = QP CS/TCs/Docs

9. Change the main AND to OR

(Assignee = Syed AND Project = QPunch – Dev) OR (Assignee = Emitta Thekkan AND Project = QP CS/TCs/Docs)
10. Select Generate to load all the results.
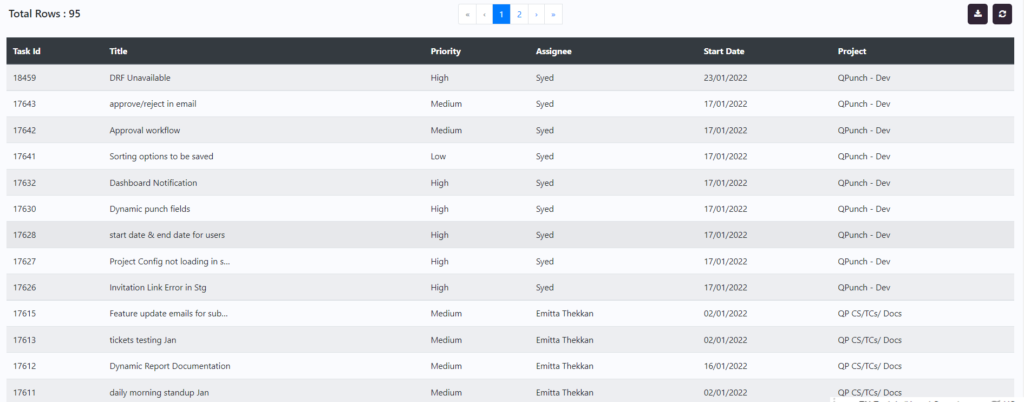
If you want to download the report Click on the download icon. Report will be downloaded in excel format.
Address On Maps
Ready To Get Started with Smart Project Management?
