The Financial Dashboard in QPunch is a centralized view of project financials. It is designed to help project managers and teams monitor planned versus actual costs, income from payment milestones, profit margins, and overall project profitability. All figures are updated in real time as soon as costs and milestone details are entered, making the dashboard a reliable tool for financial tracking and decision-making.
Enabling the Financial Dashboard
To start using the Financial Dashboard, you must first enable it for the project, and it can be done using the following steps:
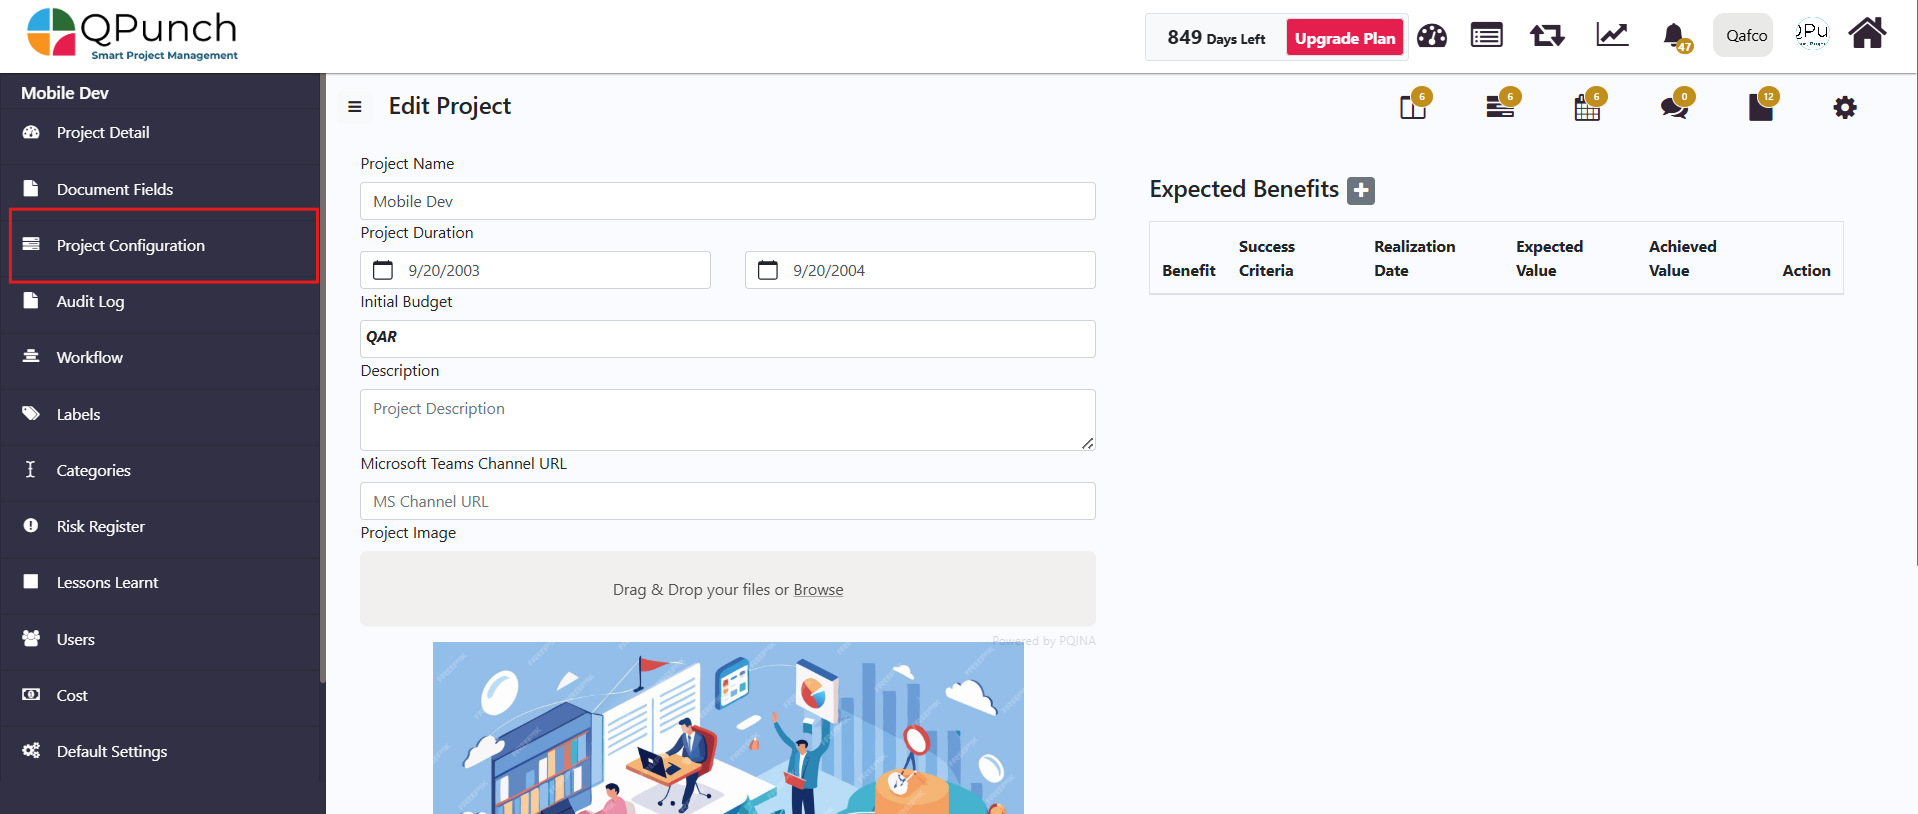
Click on the Project Settings icon.
Next, go to the Project Configuration tab.
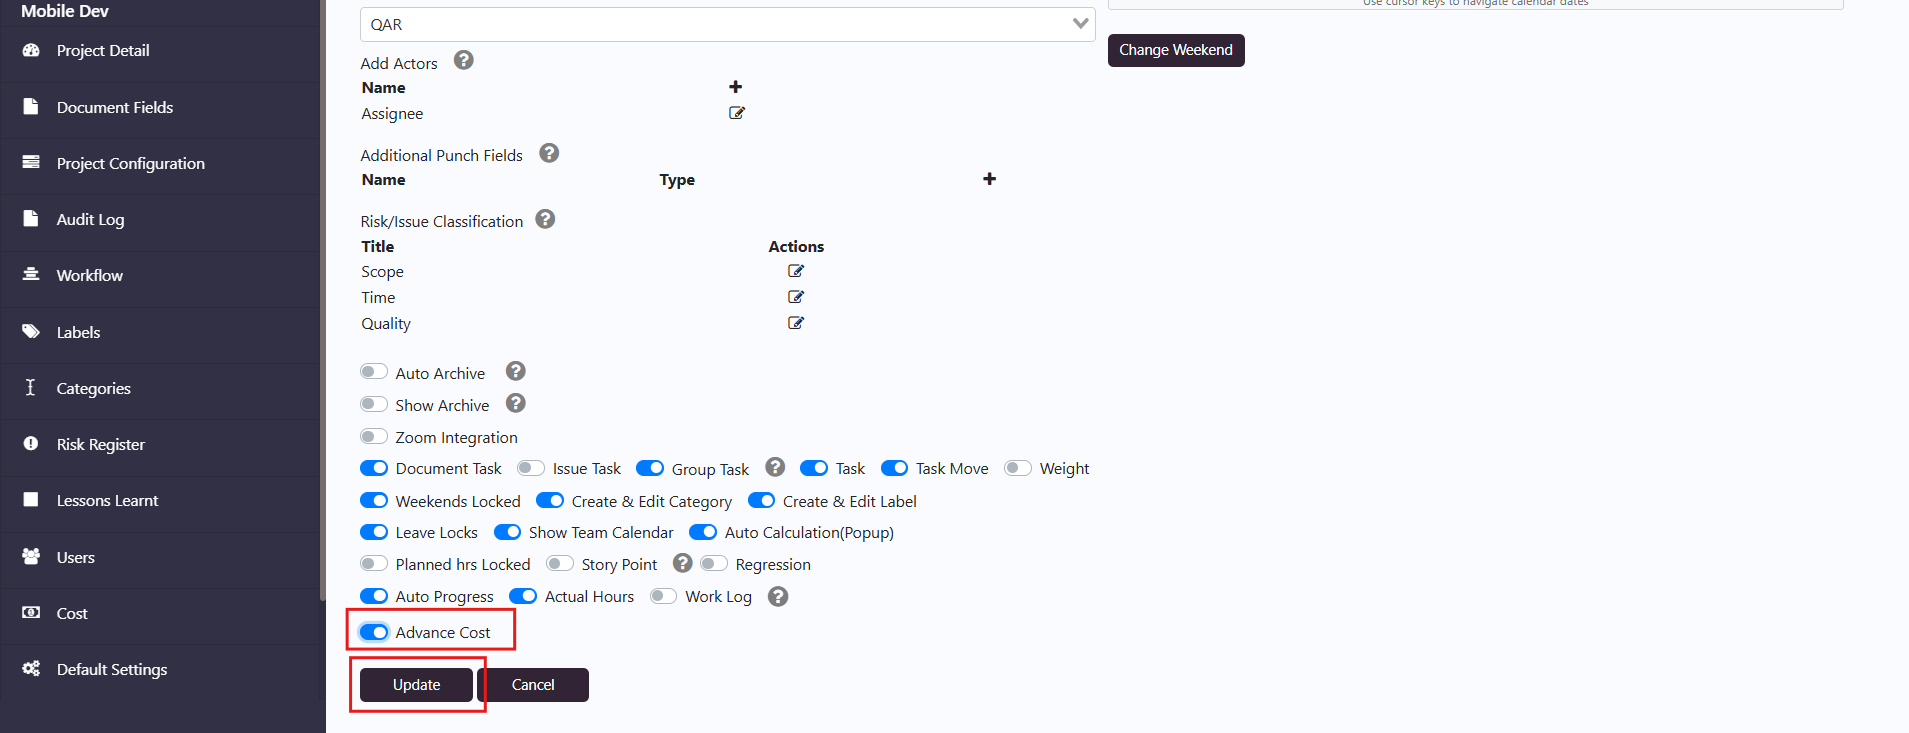
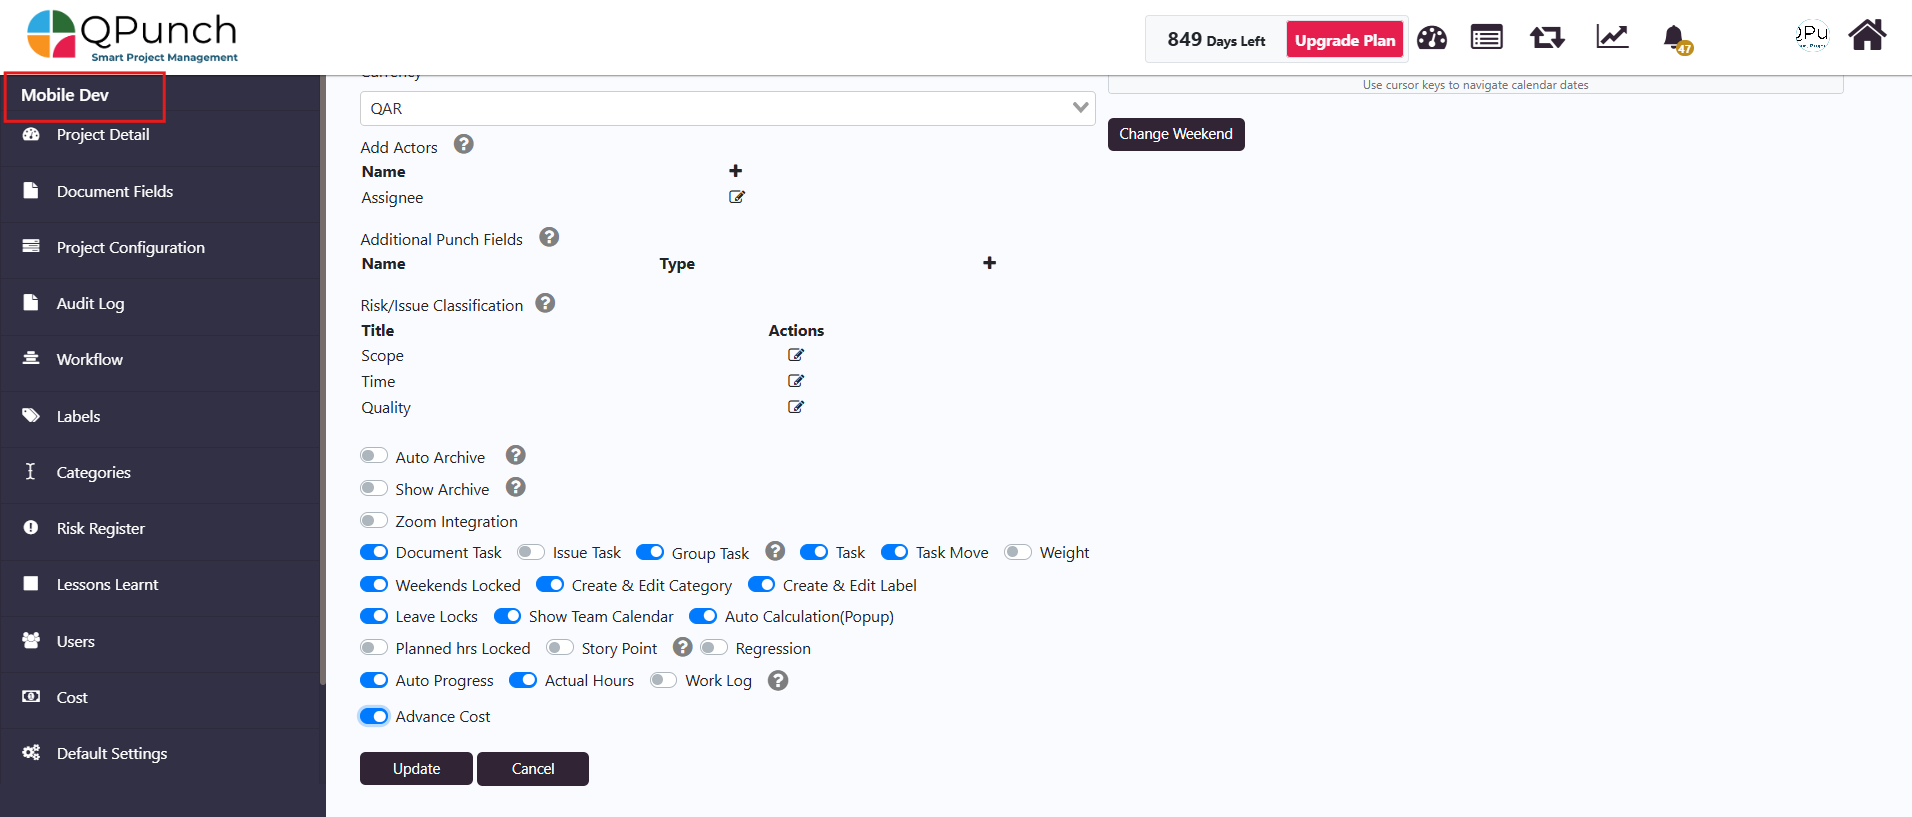
Turn on the Advanced Cost toggle, then click Update to enable the Financial Dashboard for the project.
Navigating to the Financial Dashboard
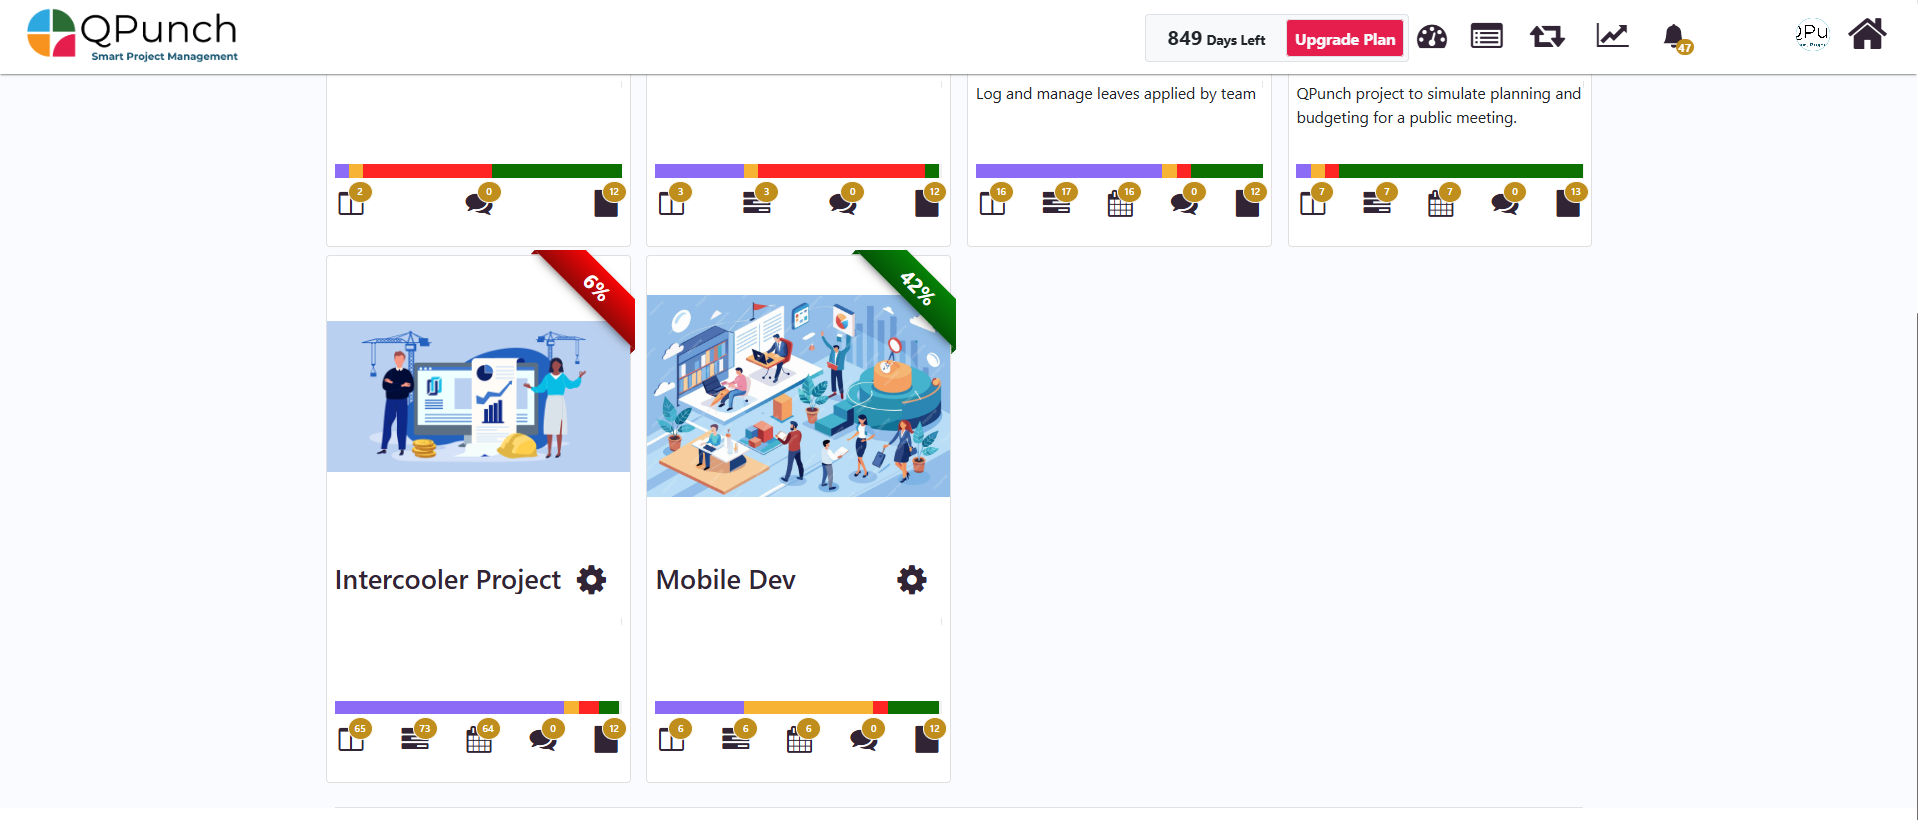
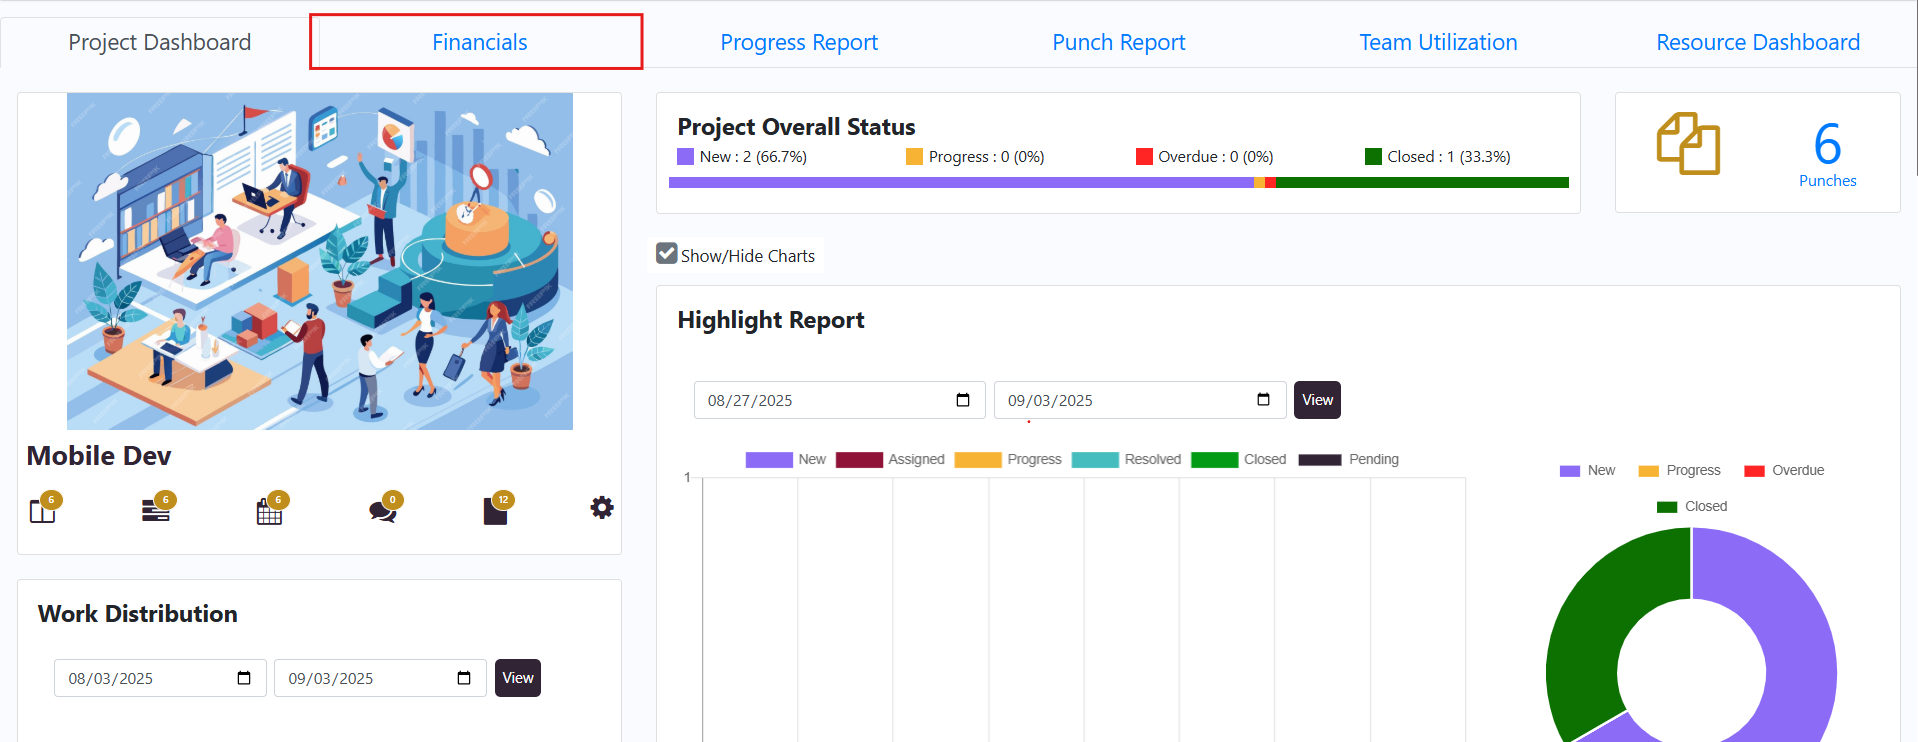
Click on the project name to open its project dashboard.
Once inside the project dashboard, click on the Financial Dashboard section.
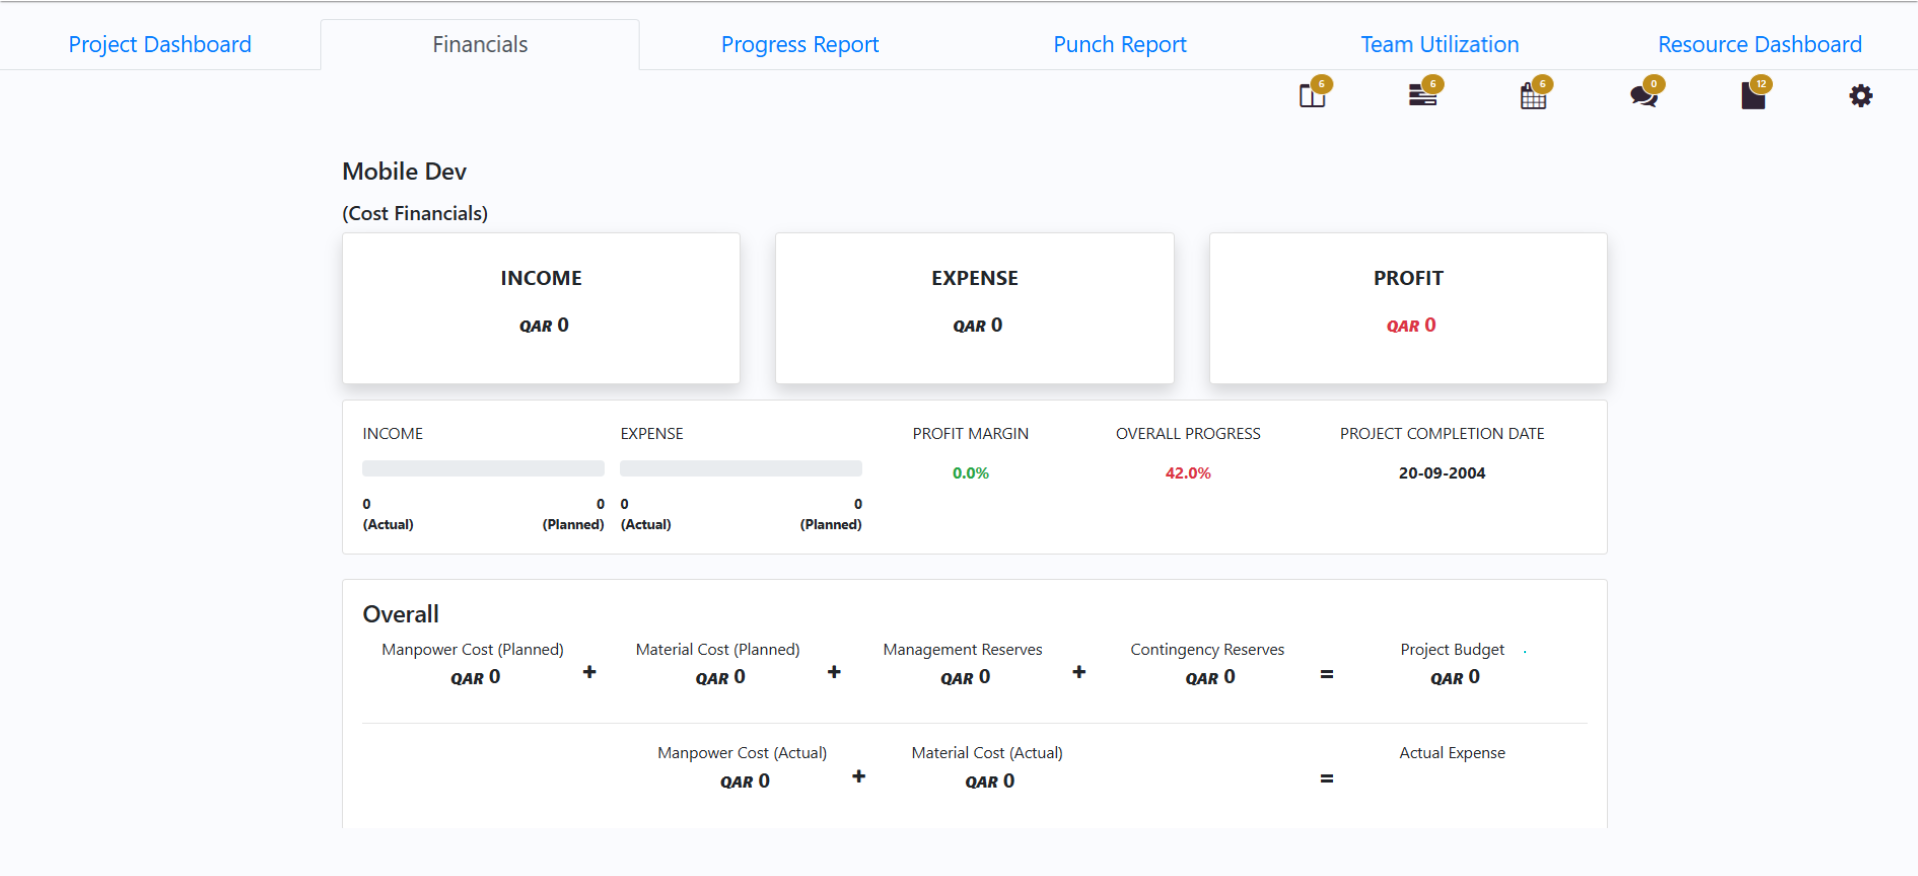
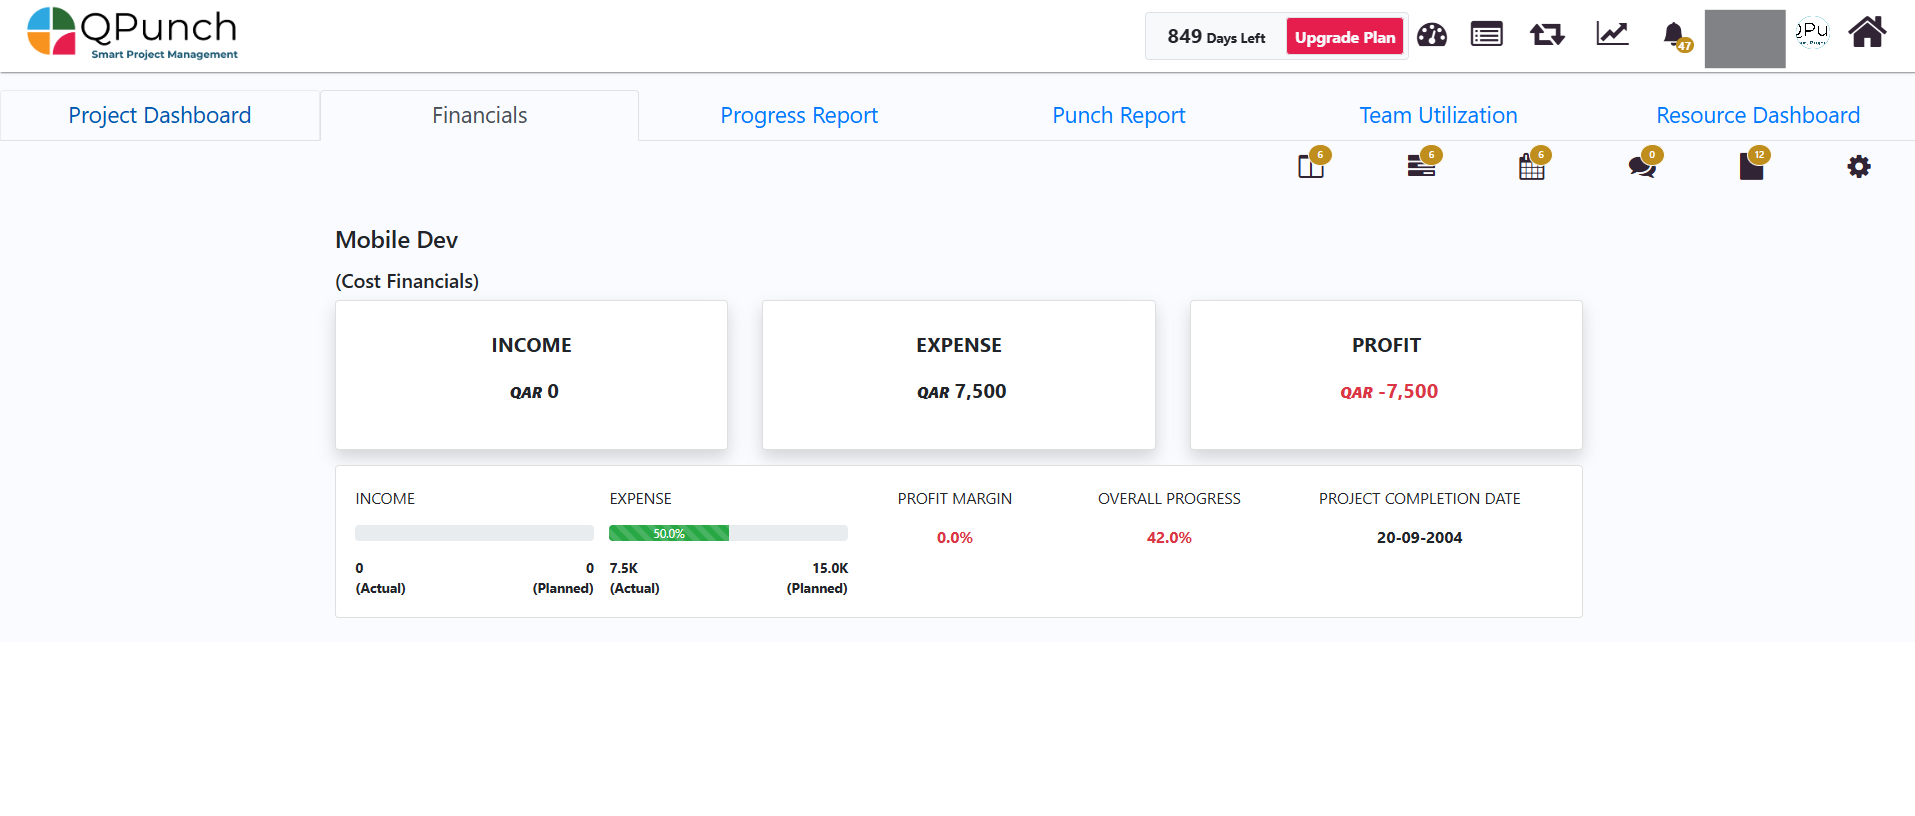
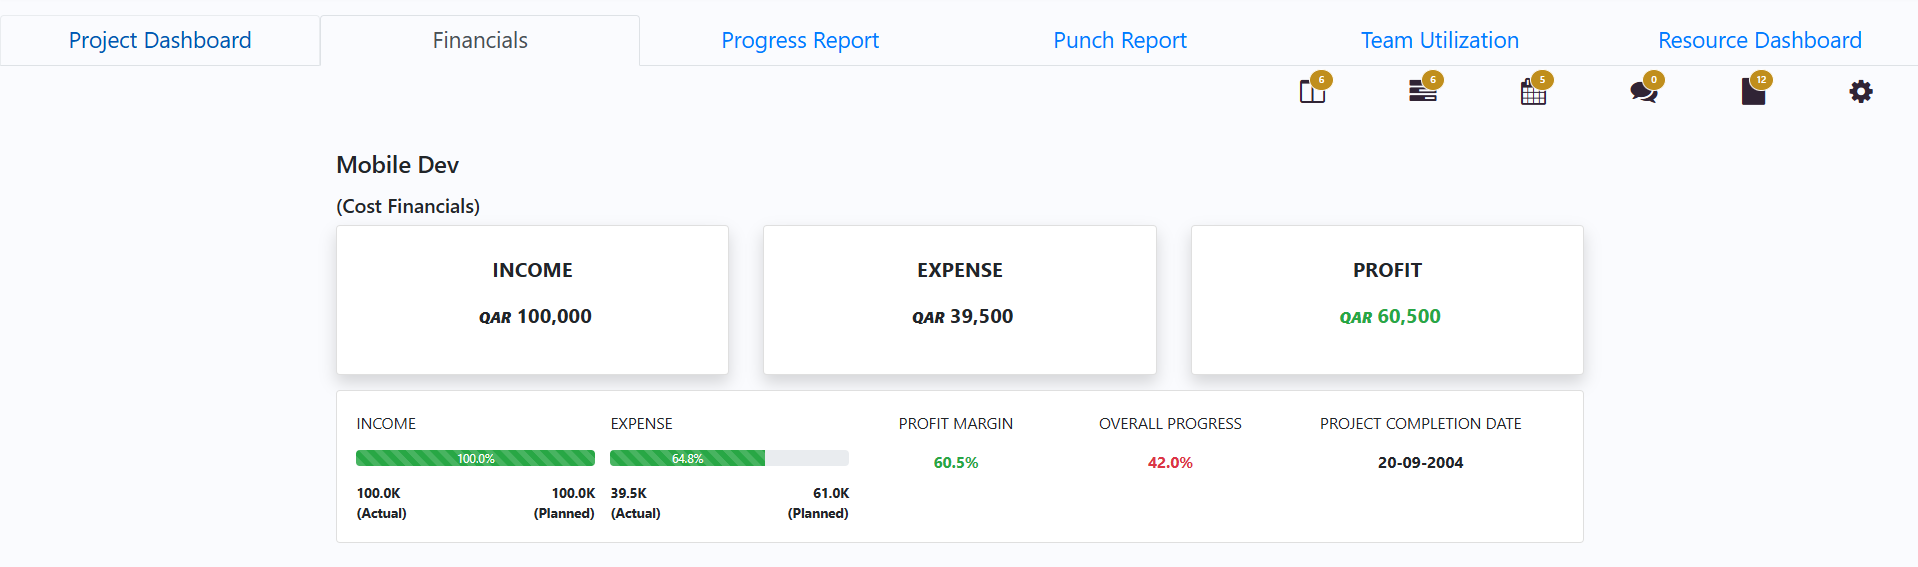
The Financial Dashboard displays the overall project income, its expenses, and its total profit. It also shows planned versus actual values for income and expenses, along with the total calculated profit margin, overall project progress, and the project completion date. By clicking on the Expenses section, you can drill down to see the total planned budget and the actual expenditure for the manpower and material costs for the project.
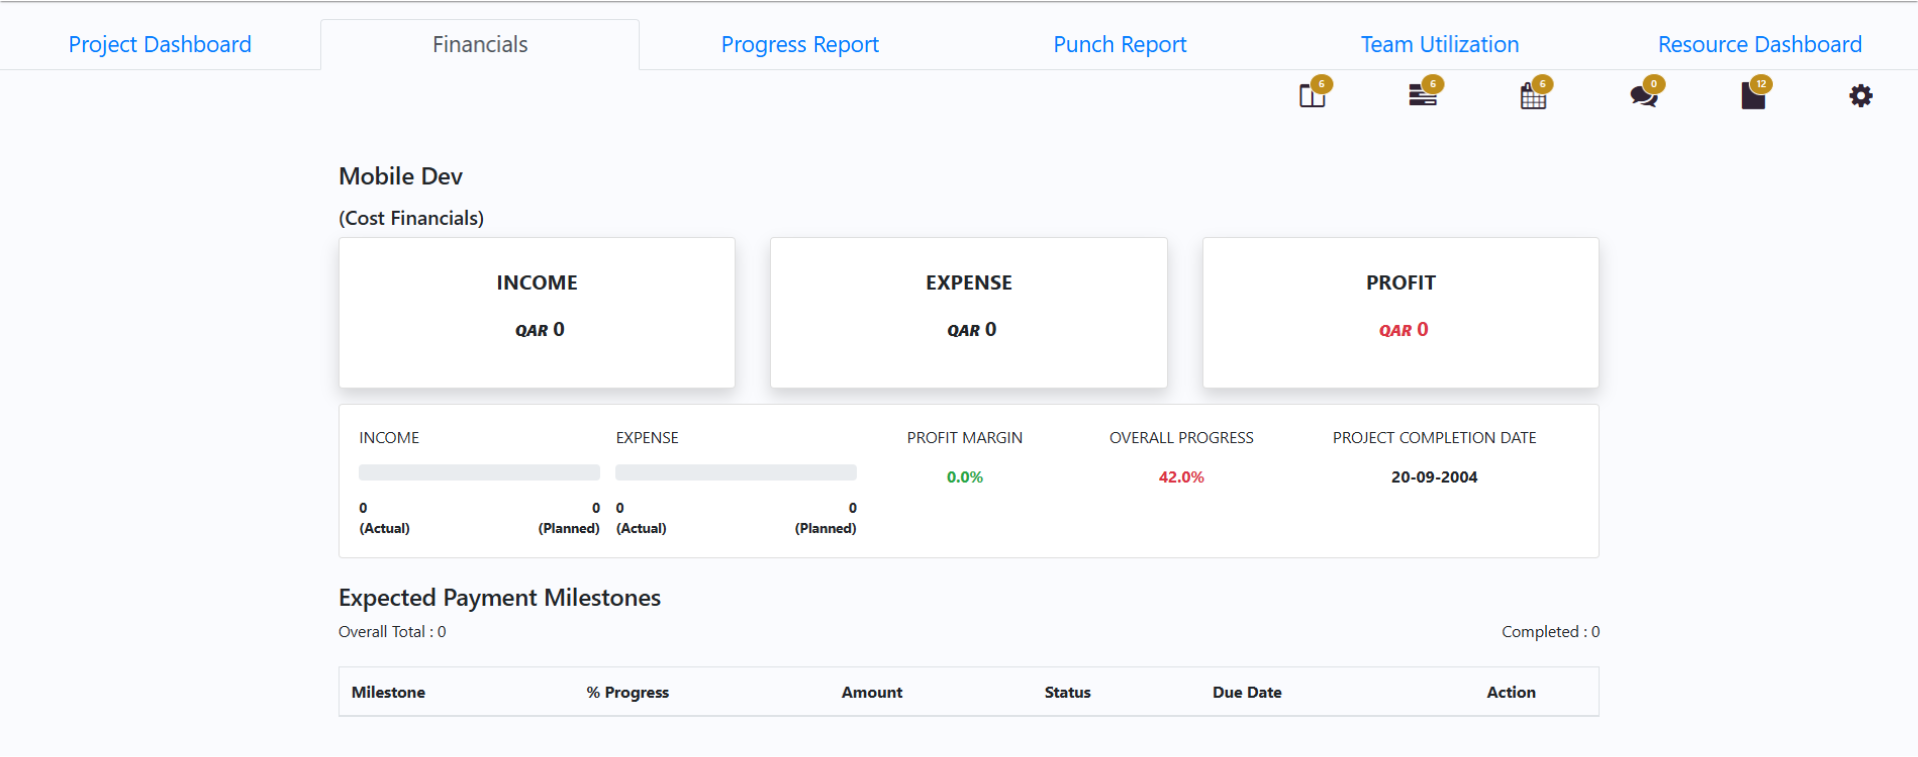
Similarly, by clicking on the Income section, you can view and manage all expected payment milestones in detail.
Adding Planned and Actual Expenses
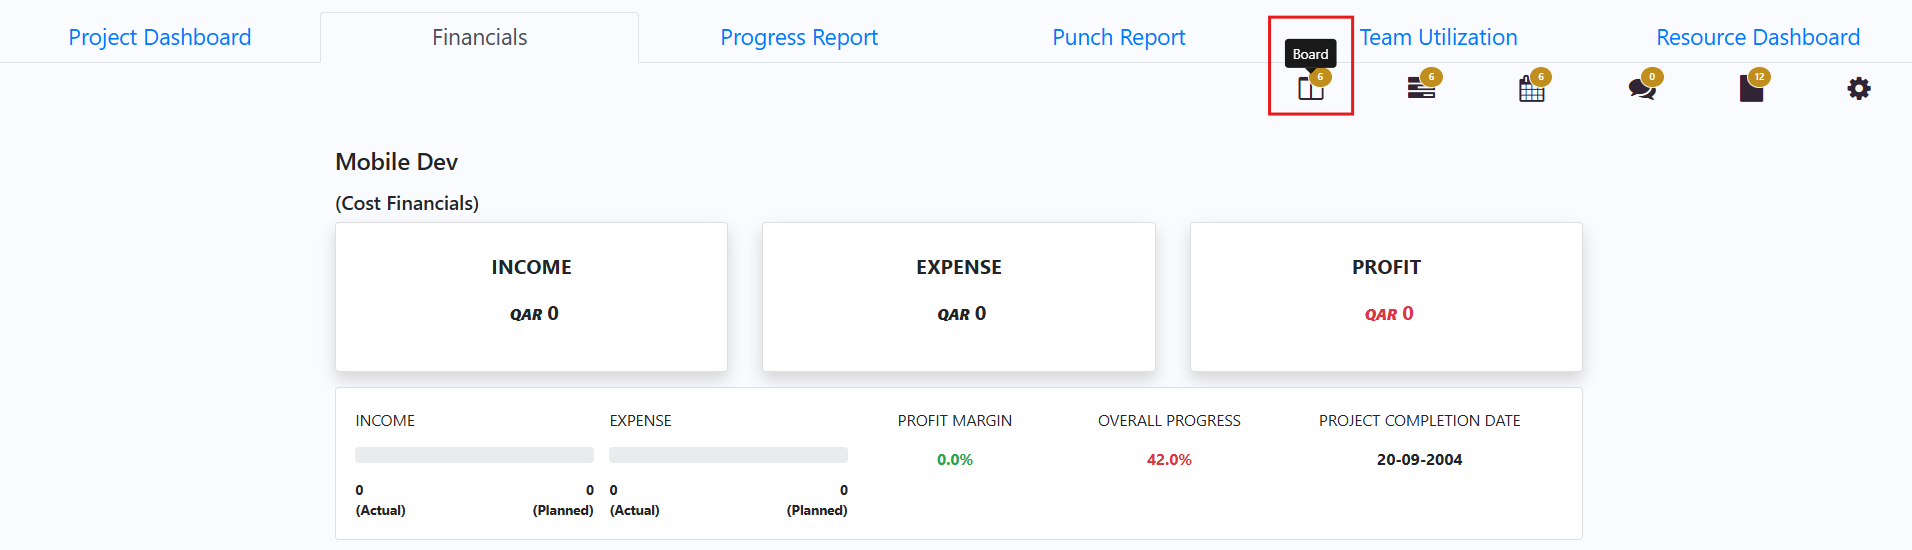
Next, to add the expenses for the task, first click on the Kanban board.
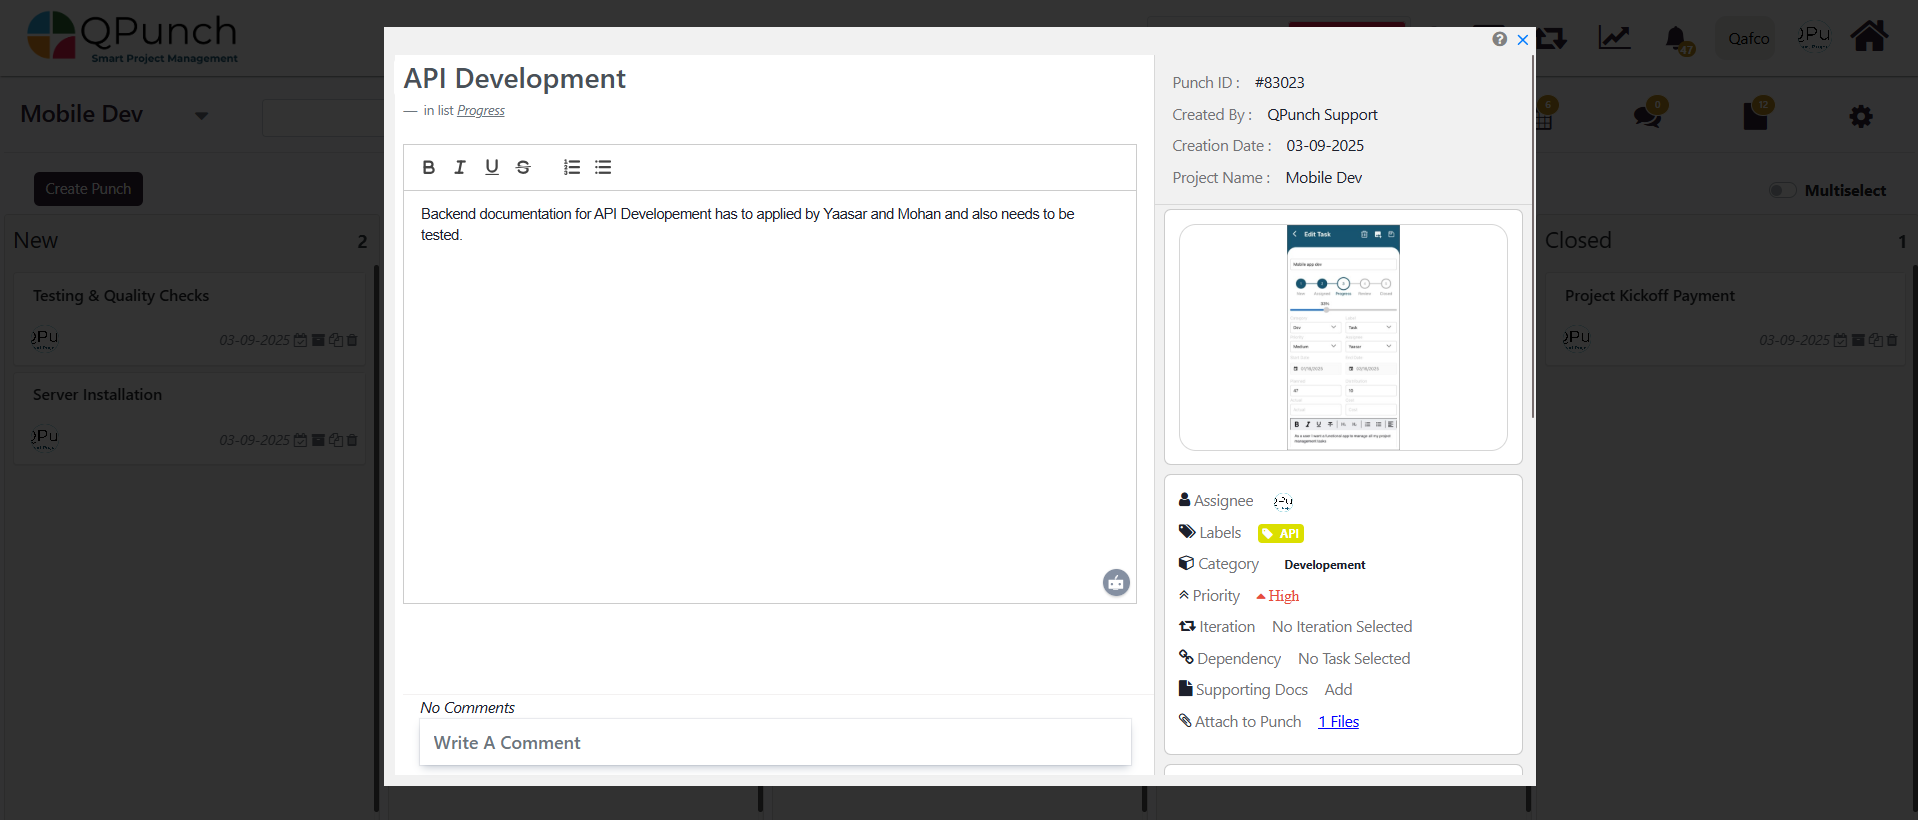
Open the task you want to add or update the cost for the task.
Manpower Costs:
For detailed steps on how to configure and manage manpower costs, refer to the Resource Costs Help File.
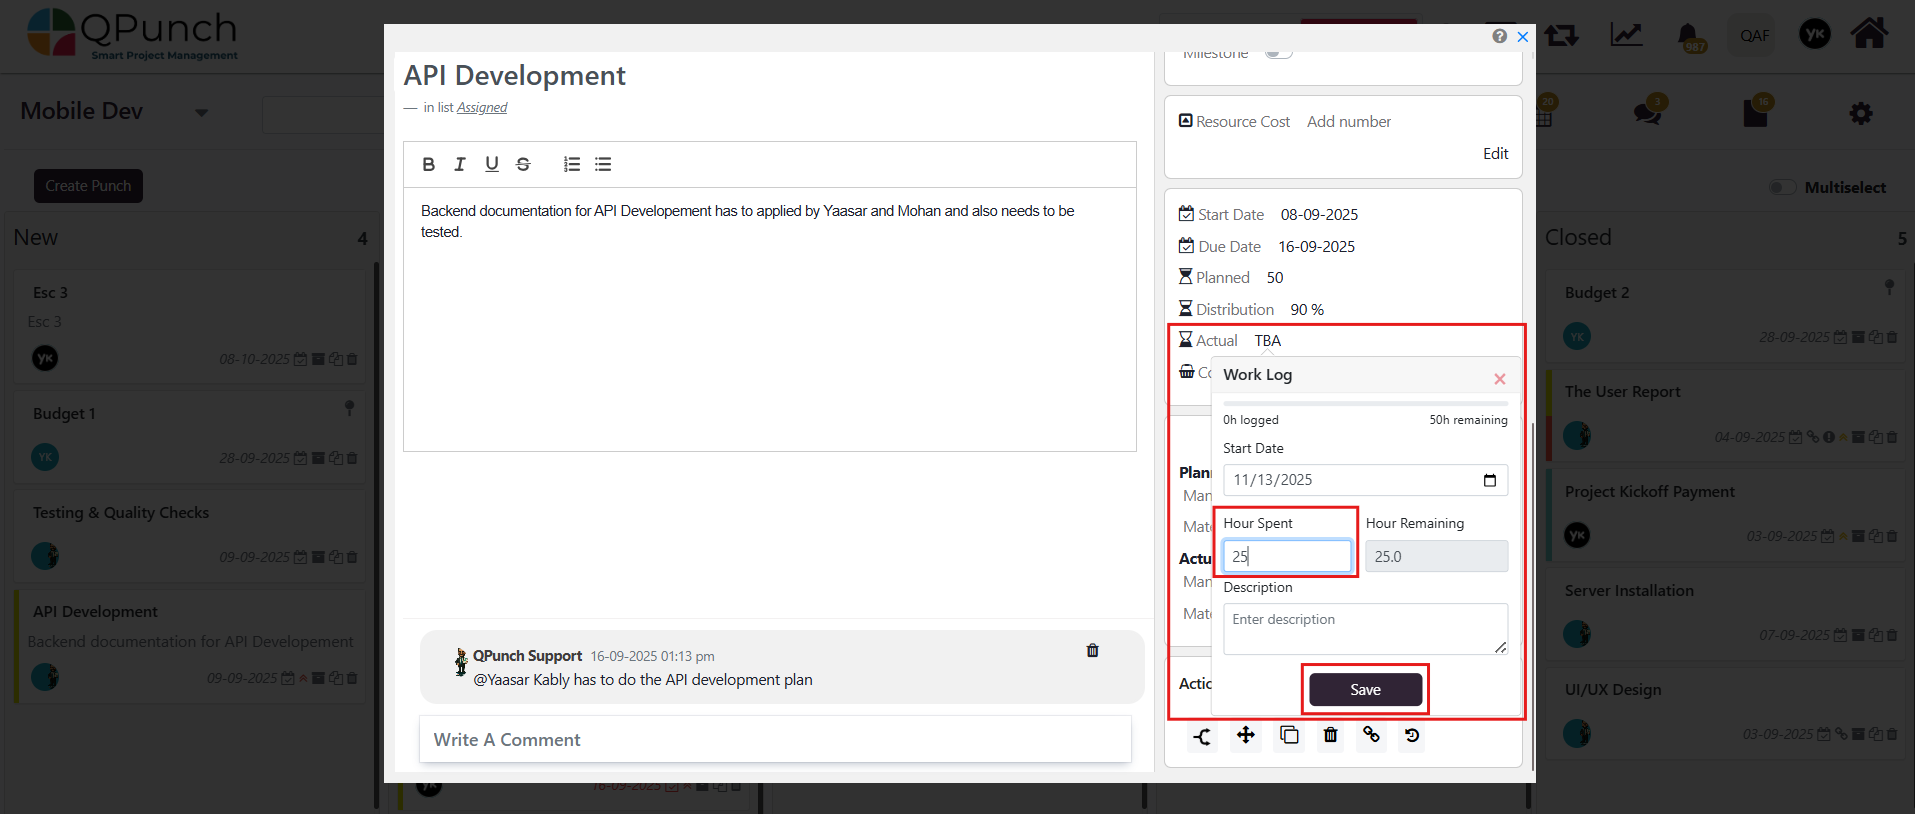
On the right-hand side of the task, scroll to the expense cost section and click on the Actual hours to log the hours spent on the task. Then, click the Save button.
Once the actual hours are logged, the Planned and Actual Manpower Costs will automatically calculate based on the user’s defined hourly rate.
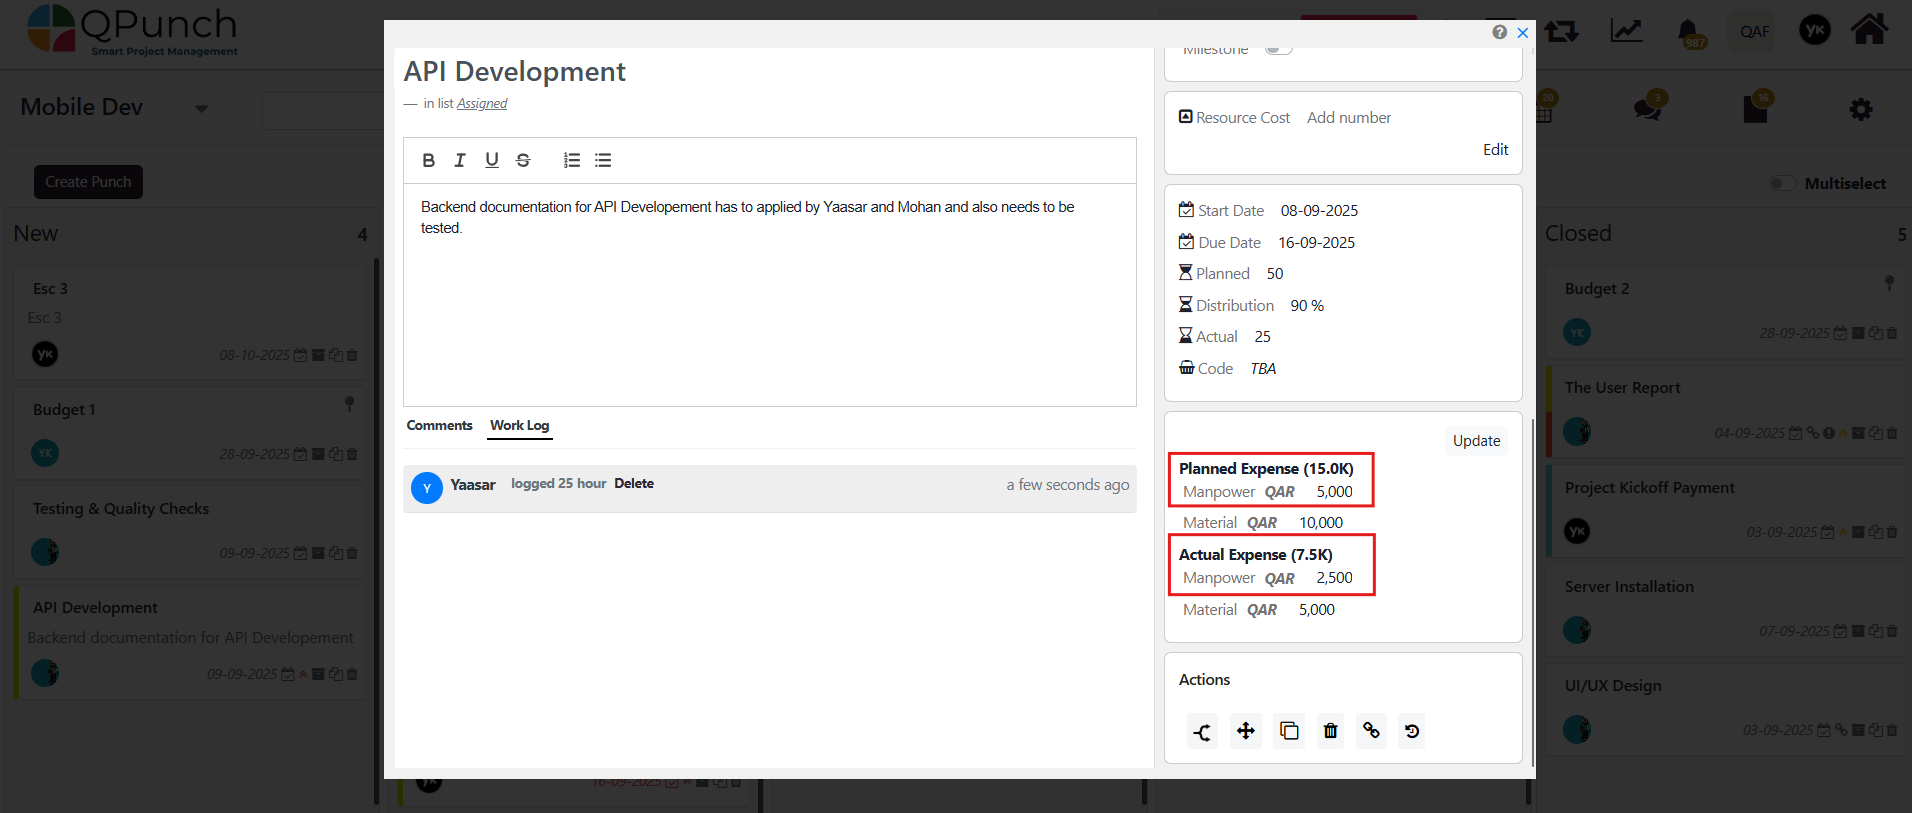
Material Costs:
In the same section, enter the planned and actual material costs manually.
Then, click Update to reflect the data in the financials dashboard.
Next, return to the Financial Dashboard, where the manpower and material costs you added will now be automatically reflected in the Expense section.
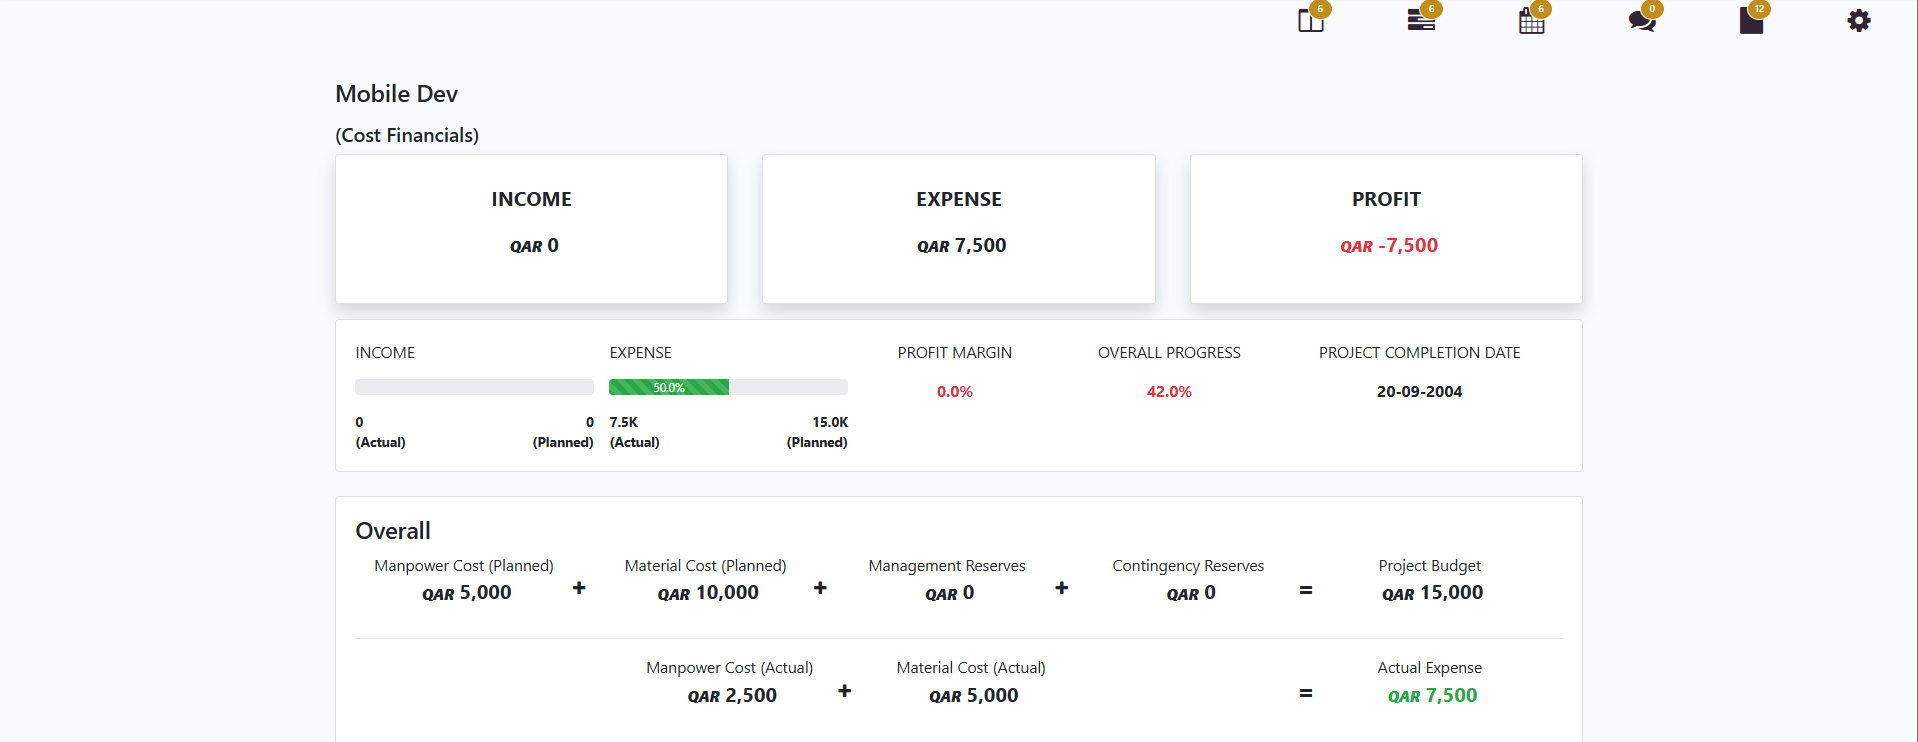
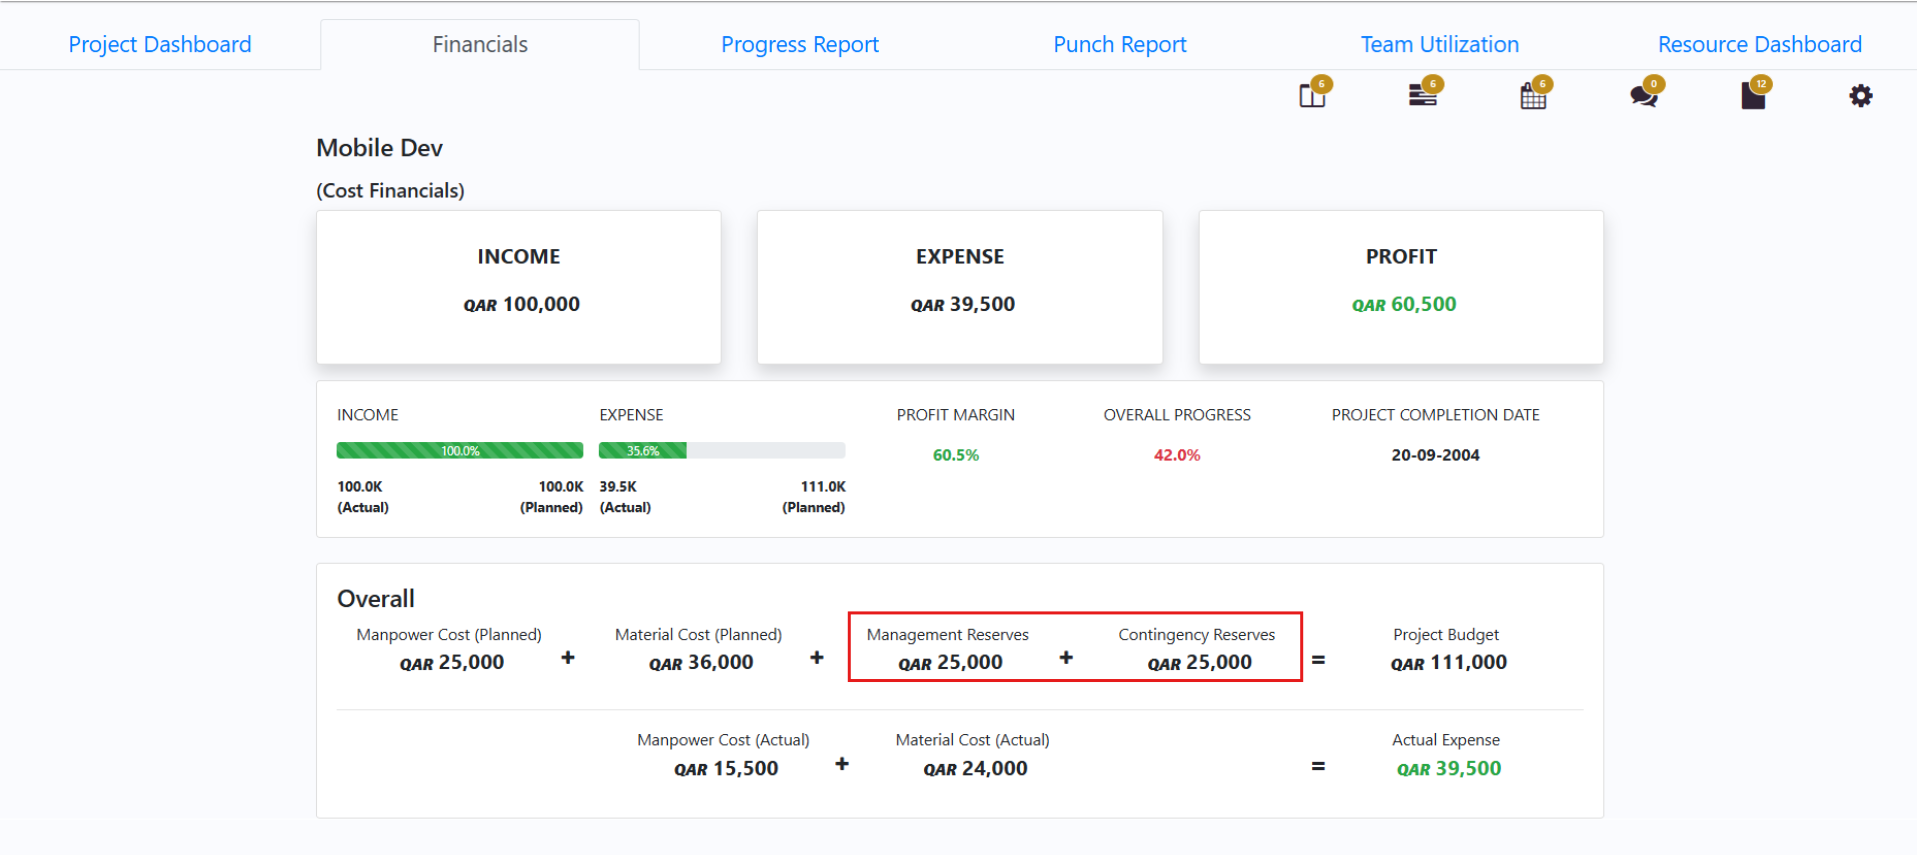
And if you now click on the expense section you can see the total planned budget is calculated from manpower, material, and any management or contingency reserves, while actual expenses spent is calculated from the manpower and material costs entered. This gives a clear view of whether project spending is on track or overshooting the planned budget.
Adding Income Through Payment Milestones
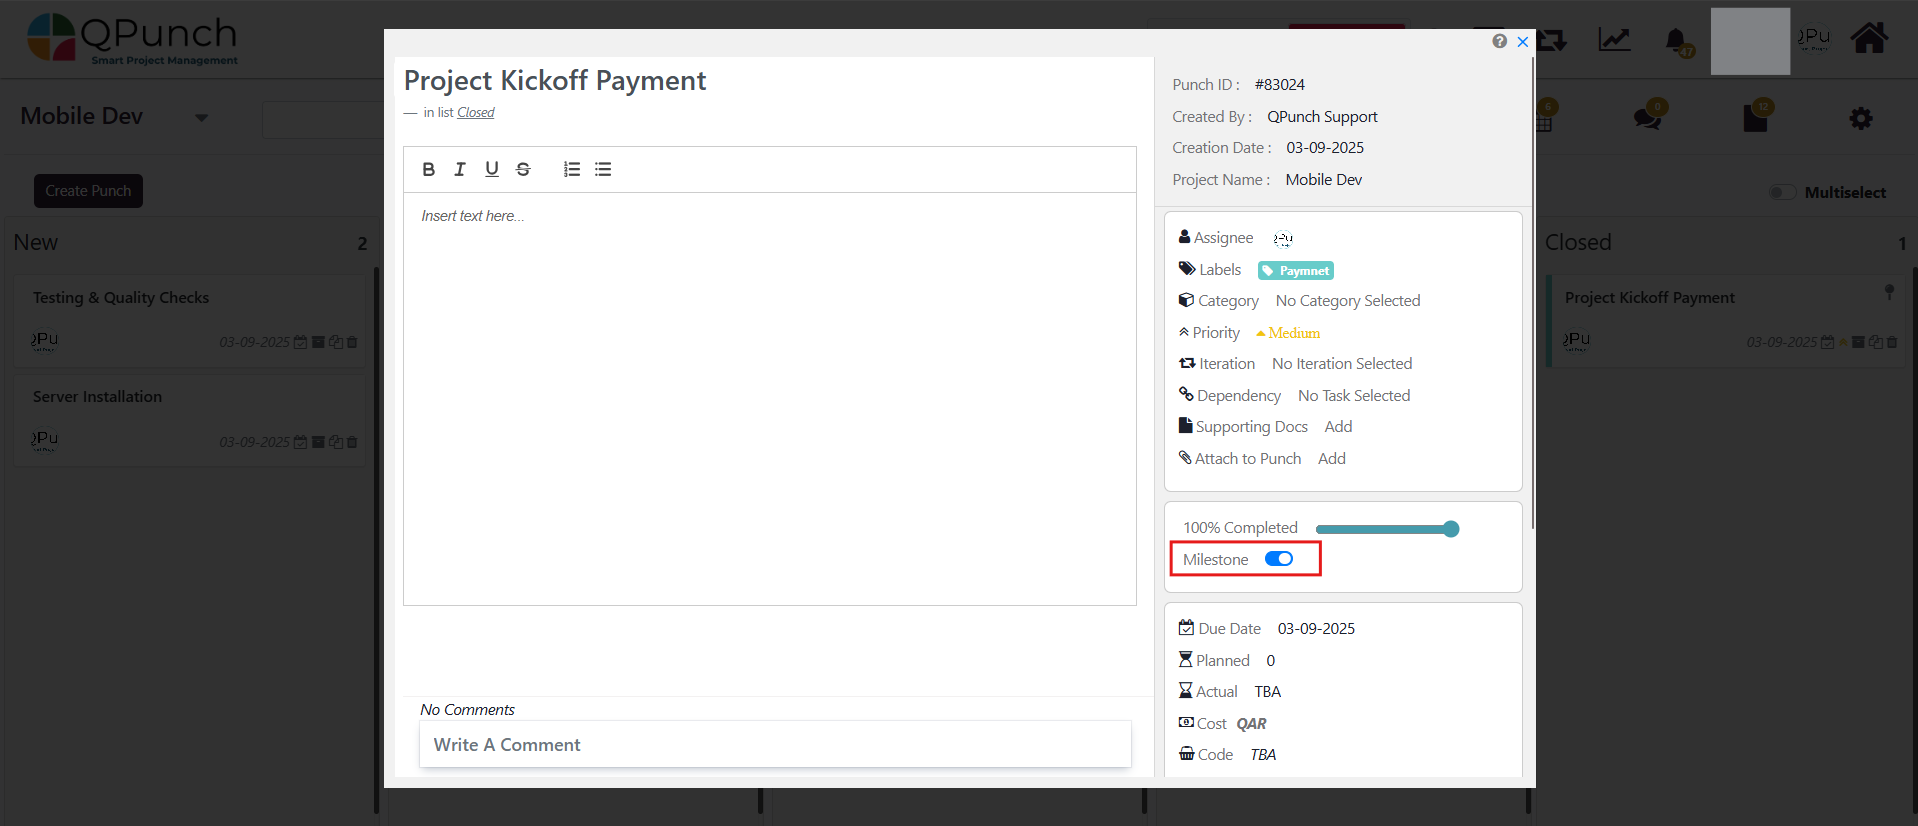
Next to add the Income for the project and go back to the kanban board and create a payment milestone.
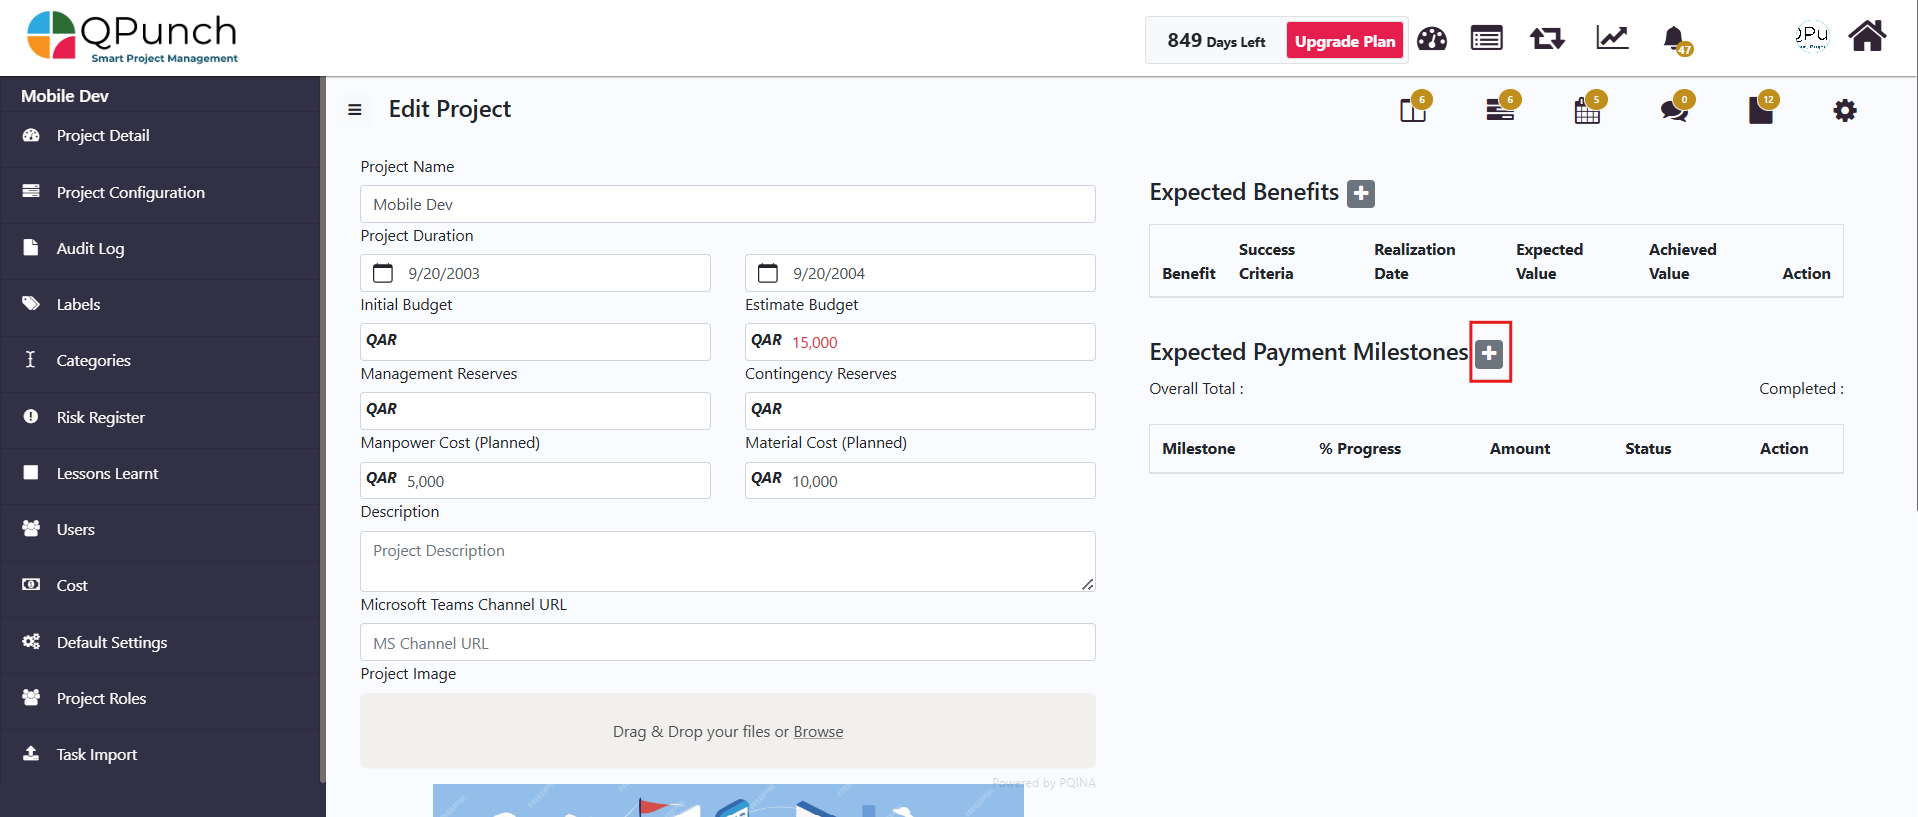
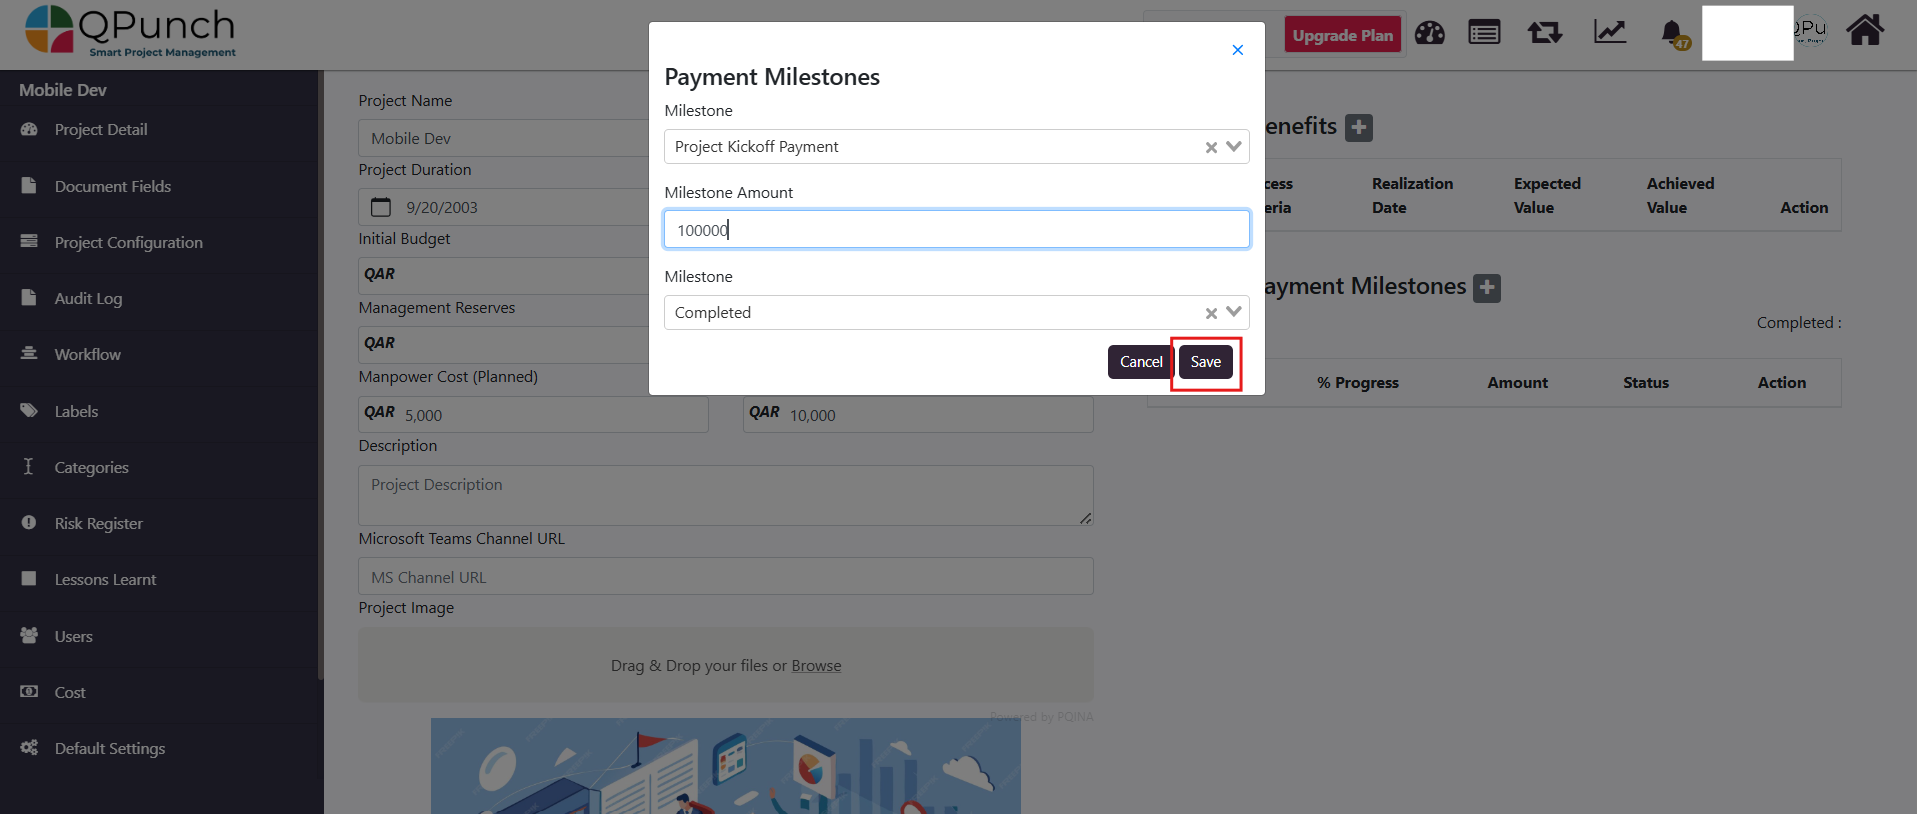
After adding the milestone, go to Project Settings → Project Details Tab and Under Expected Payment Milestones, click the ➕ Add button to add the payment milestone.
Next select the milestone you want to add as a payment milestone and add the amount for that milestone, also If the payment has been received, mark the milestone as Completed once the details have been added Click on Save button.
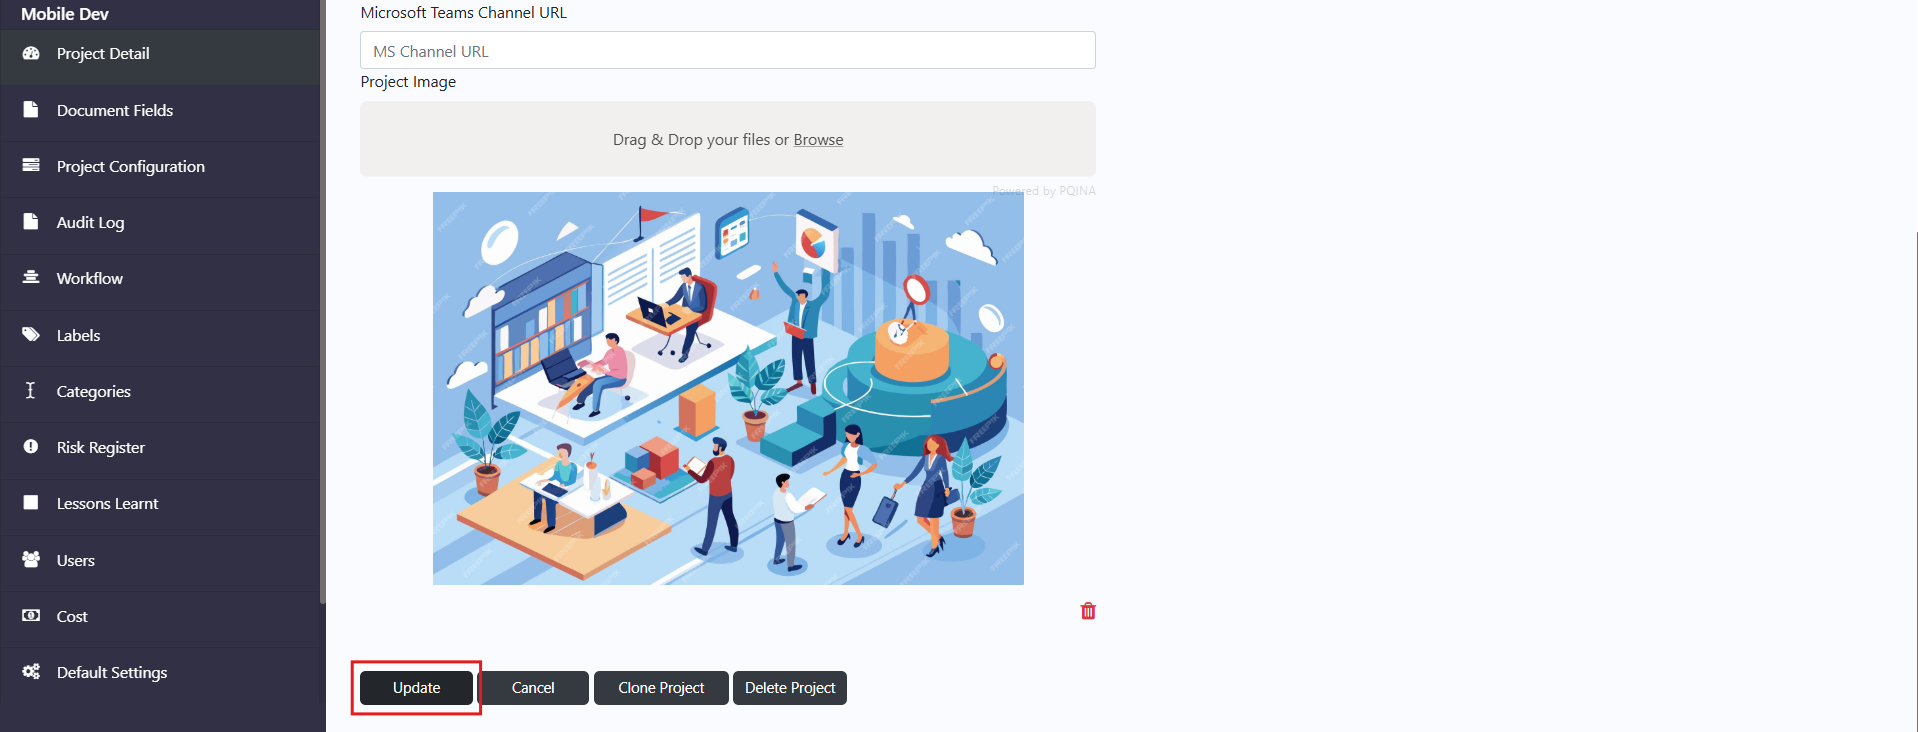
After adding the payment milestone, click the update button, and the payment values will then be updated and displayed in the Financial Dashboard.
Now, go back to the Financial Dashboard. And you will see the income has been updated properly.
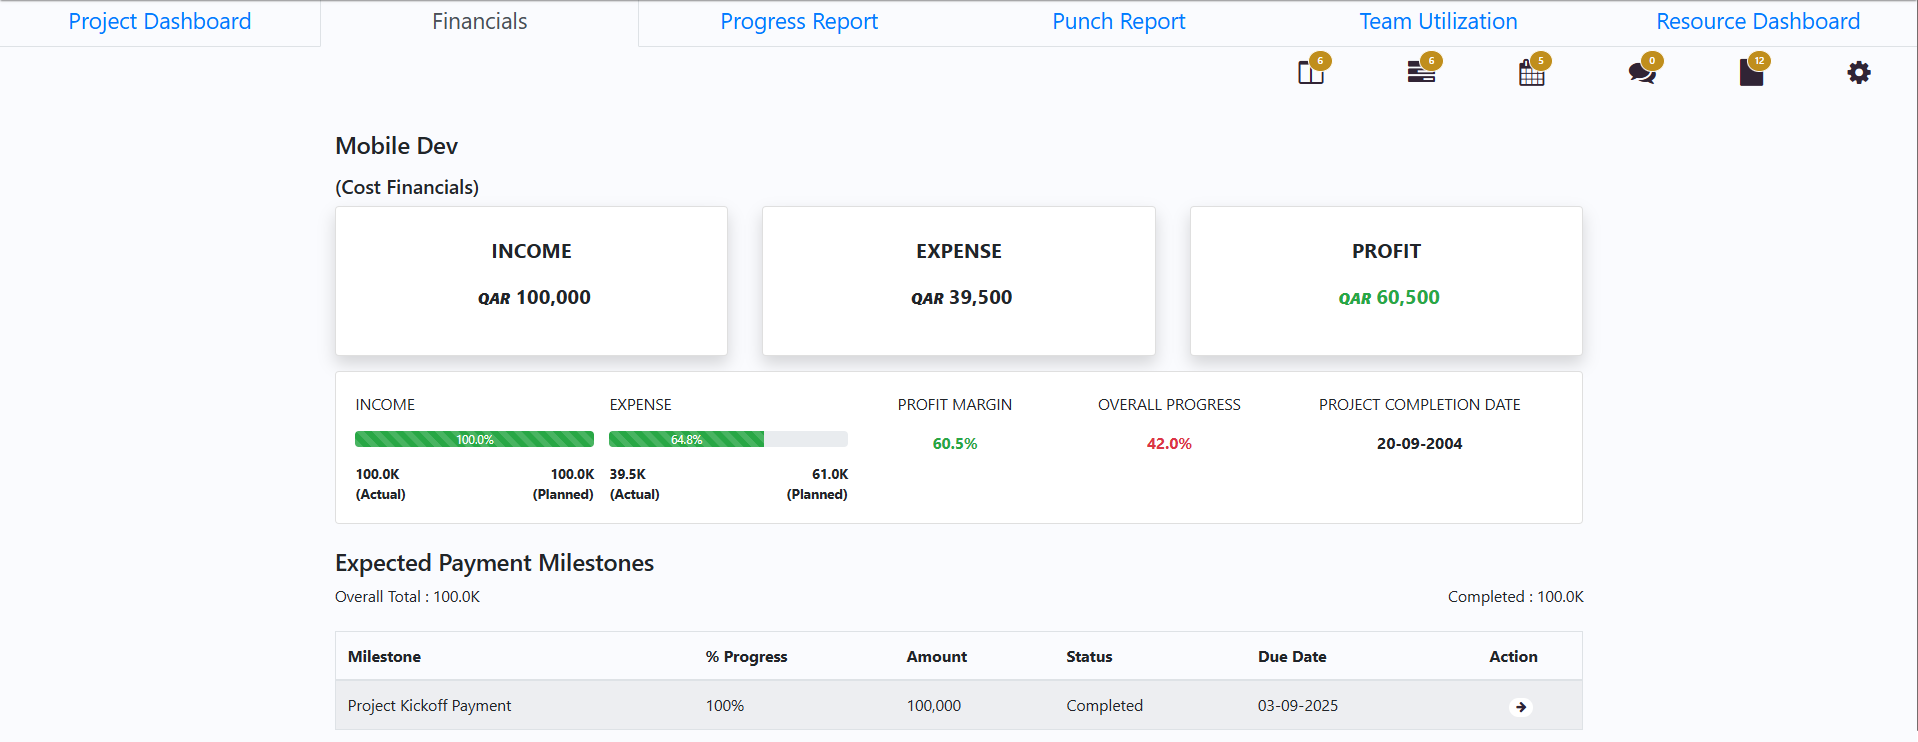
Now click on the income section to drill down and view the Expected Payment milestone table with all relevant details such as progress %, amount, status, and due dates for each payment to give you a clear overview of the project progress.
Adding Project Reserves
In addition to task costs and payment milestones, the Financial Dashboard also considers reserves that are defined at the project level.
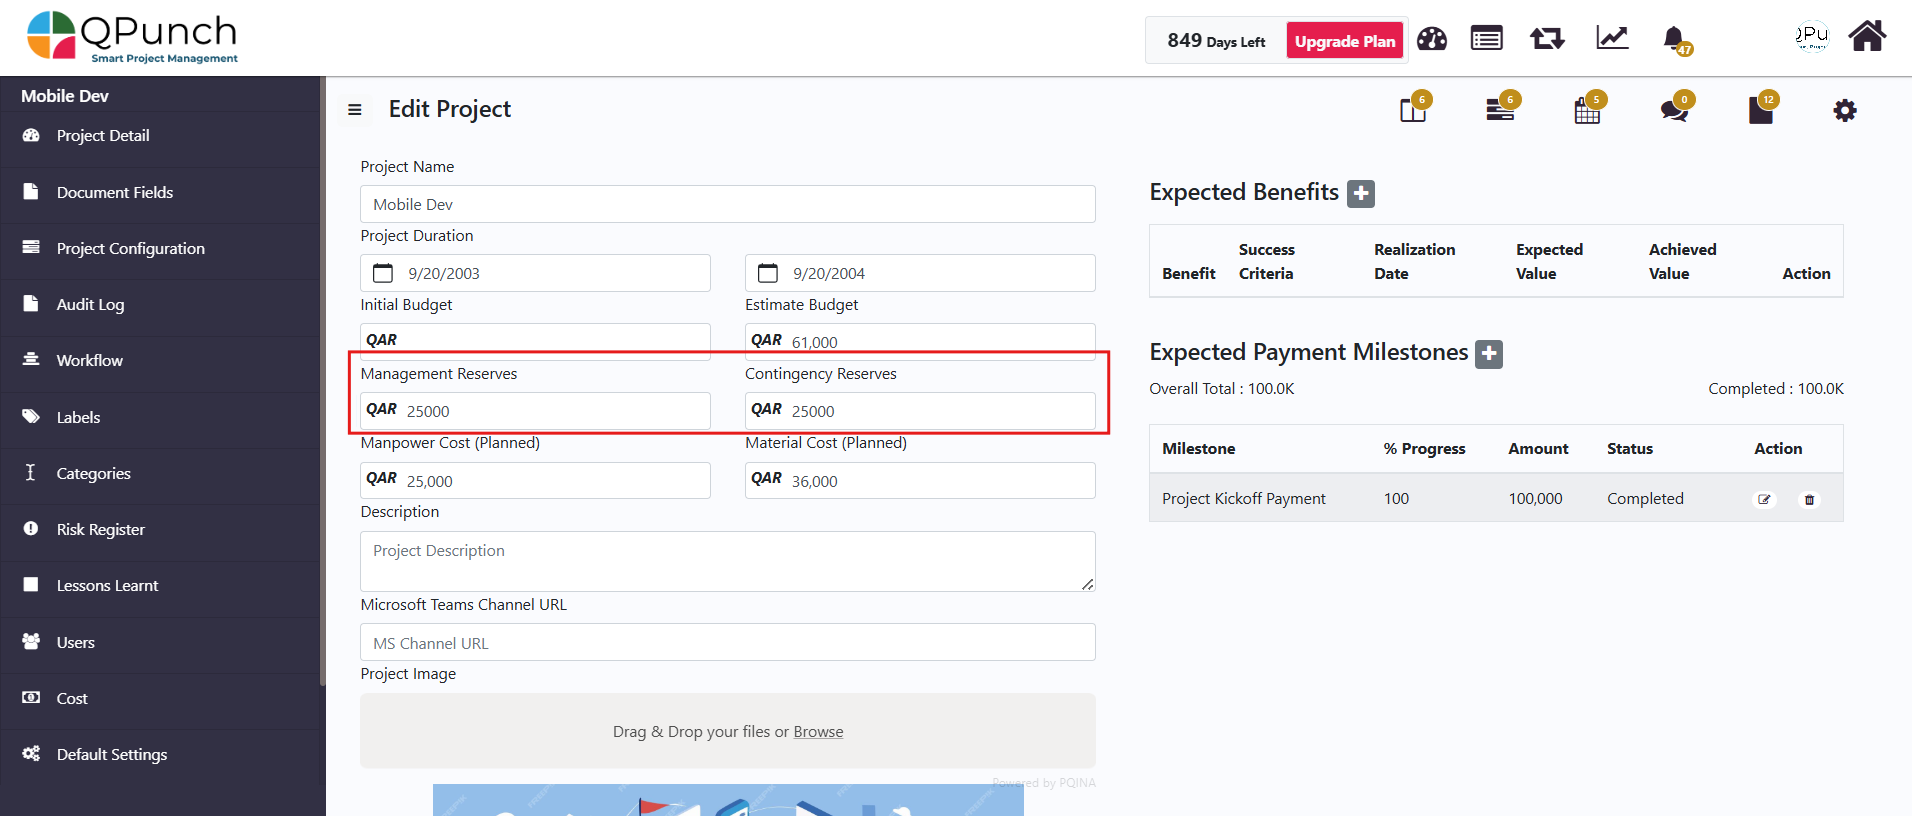
To add or update these, go to Project Settings → Project Details.
Here you can add or update the values for management reserves and contingency reserves.
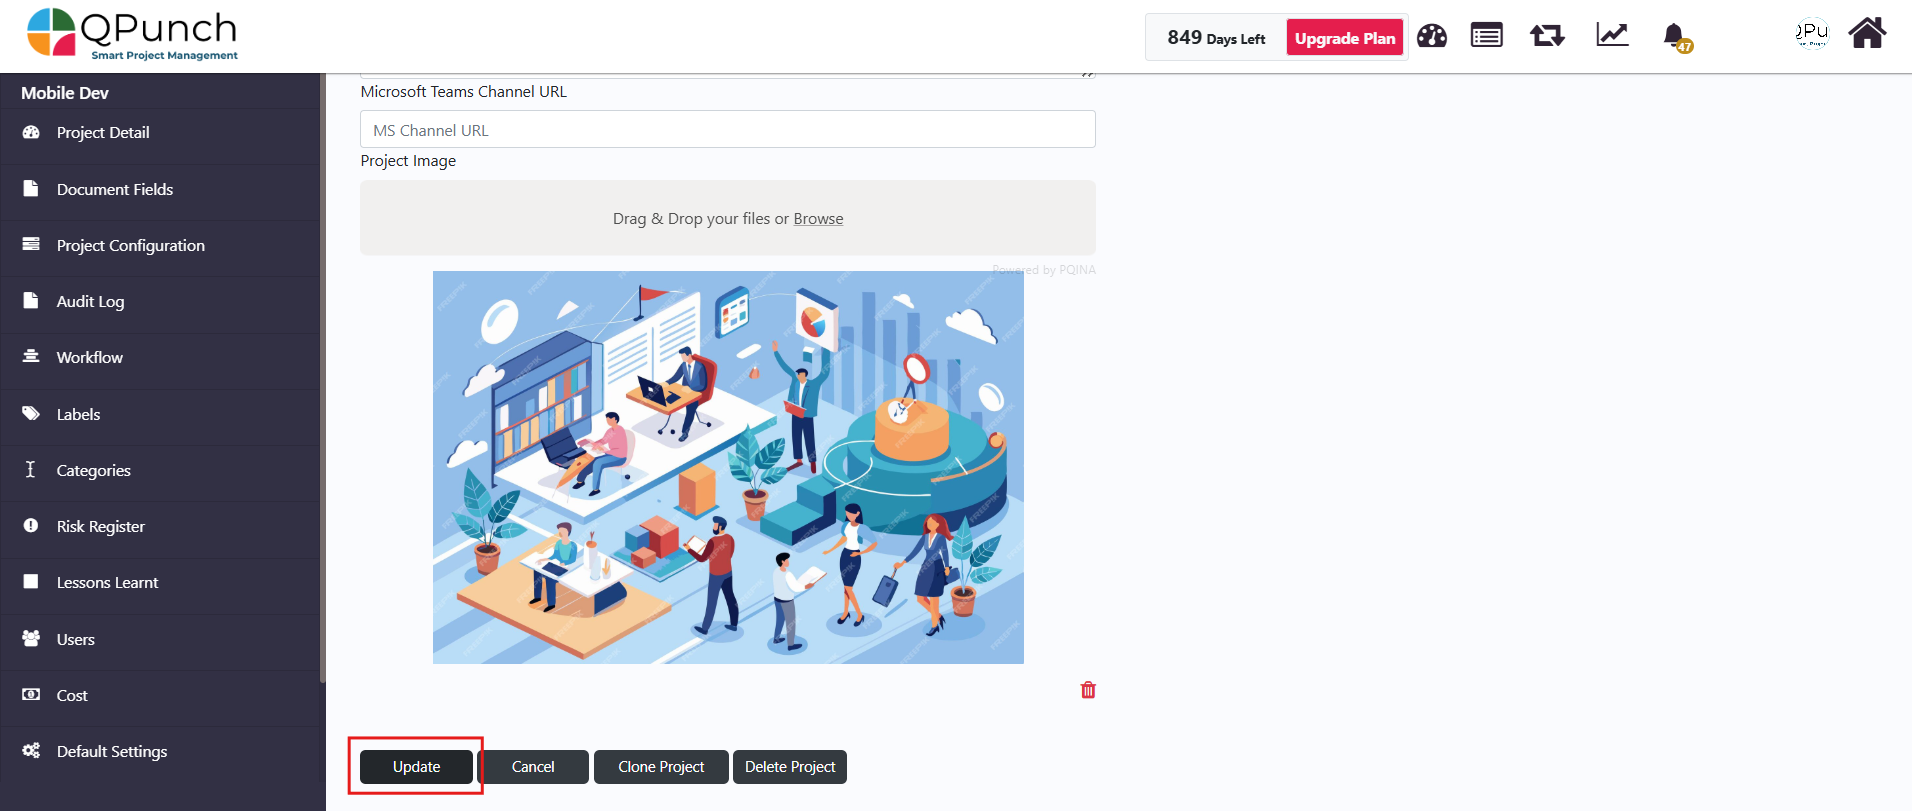
Once added, click on the Update button.
The values will then be updated and displayed properly in the Financial Dashboard, ensuring that the overall budget includes provisions for risks and unexpected costs.
Viewing the final Financial Report
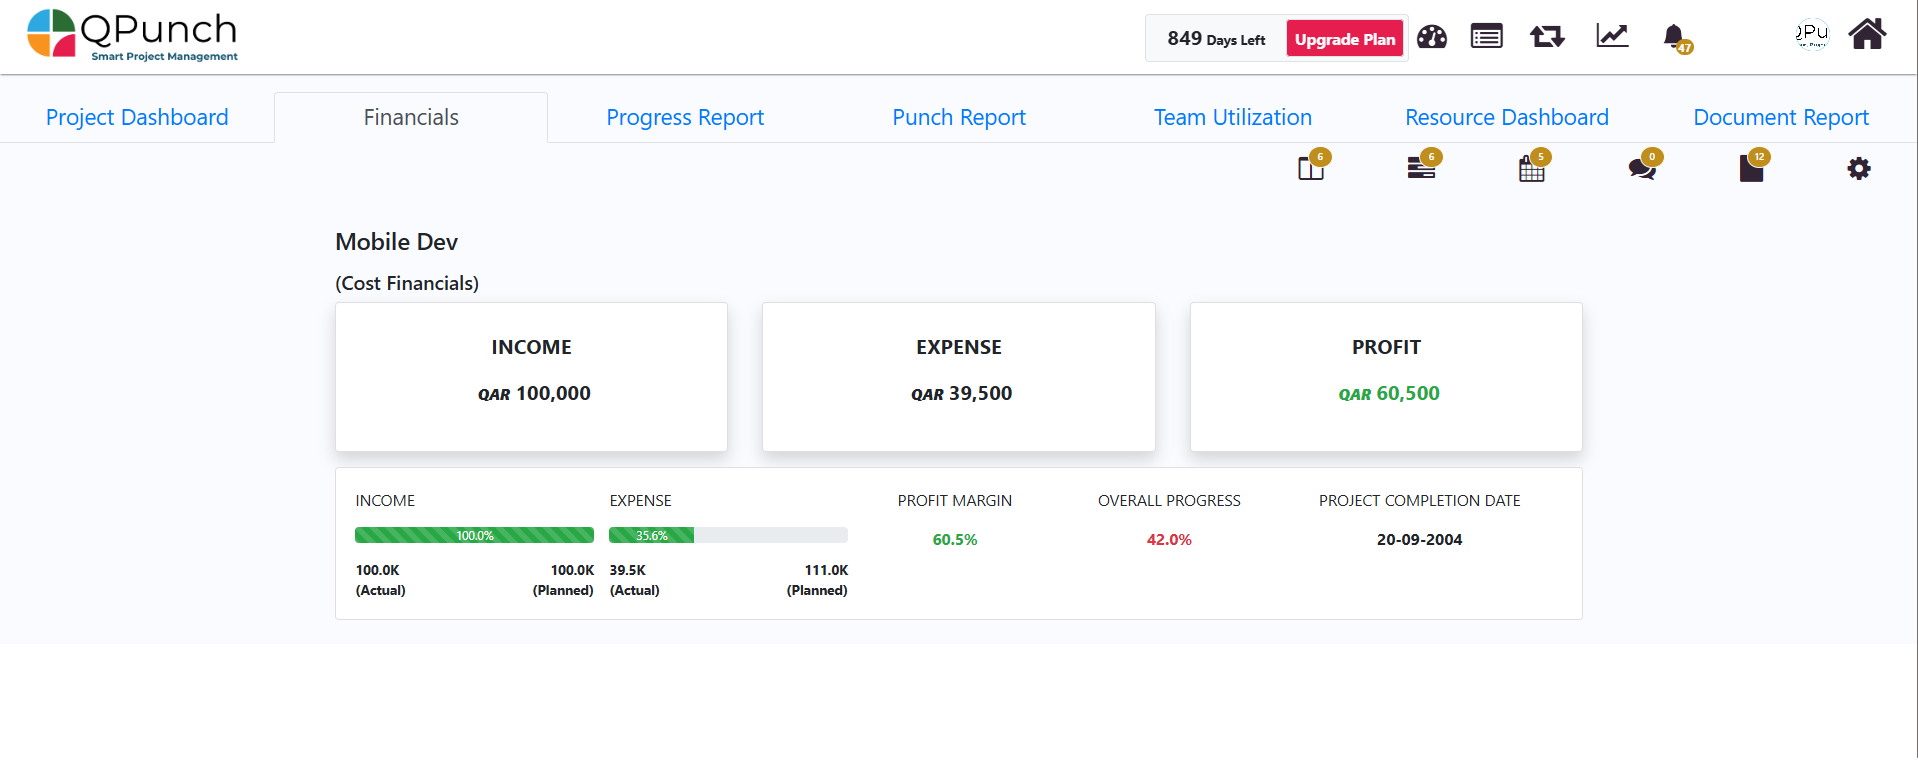
After costs, milestones, and reserves are entered, the Financial Dashboard provides a consolidated report. It displays the project’s total income, expenses, and profit margin, along with overall project progress and the projected completion date.
This single view gives project managers a clear, real-time snapshot of the project’s financial status, making it easier to monitor profitability and control costs.
Conclusion: The Financial Dashboard in QPunch streamlines project financial management by consolidating income, expenses, profit margins, and progress into a single view. With automatic updates from tasks, milestones, and project settings, managers no longer need to track data manually. The dashboard ensures transparency, reduces errors, and provides the financial insight needed to keep projects on budget and profitable.