Set Gantt Chart Elements
1.Time Scale:
You can quickly navigate or focus your timeline in a variety of ways:
- Zoom in or out to see more or less of your timeline.
- Scroll horizontally or vertically
- To adjust the zoom levels of your chart, use the Zoom in, Zoom out, Zoom to Fit tabs in the toolbar.

- You can zoom in max to see the tasks on hourly basis. If you zoom out to a point, it will show you tasks based on days, weeks, months etc. You can zoom out max to see the tasks on yearly basis.
- When you click on Zoom to Fit it will provide you monthly view.
2.Collapse All & Expand All:

- Click Collapse All in the toolbar to collapse all folders and projects that live in the project you have selected.
- Click Expand All in the toolbar to expand all folders and projects that live in the project you have selected.
3. Undo & Redo:

- You can Undo the actions you have taken on the Gantt chart
eg. Creating a dependency, rescheduling a task etc…
- You can Undo your actions if your workspace hasn’t refreshed or you haven’t switched to a different folder, project or space
- You can redo the cancelled actions by clicking on Redo tab. Redo can be done until you switch to another view or refresh the page.
4. Auto Scheduling:

Auto Scheduling helps to recalculate tasks schedules when you change the start date of your tasks or projects or add dependencies to tasks, which effects on the tasks start/end dates and durations. As you create dependencies between items, your chart will automatically update so that successor tasks do not start until their predecessor is complete or until the predecessor is estimates to complete. As you move items around in your structure or change dependencies, your tasks will move within your timeline as well.
5. Dependencies:
Dependencies are defined based on issue links. Changing dependencies creates or removes links between issues.
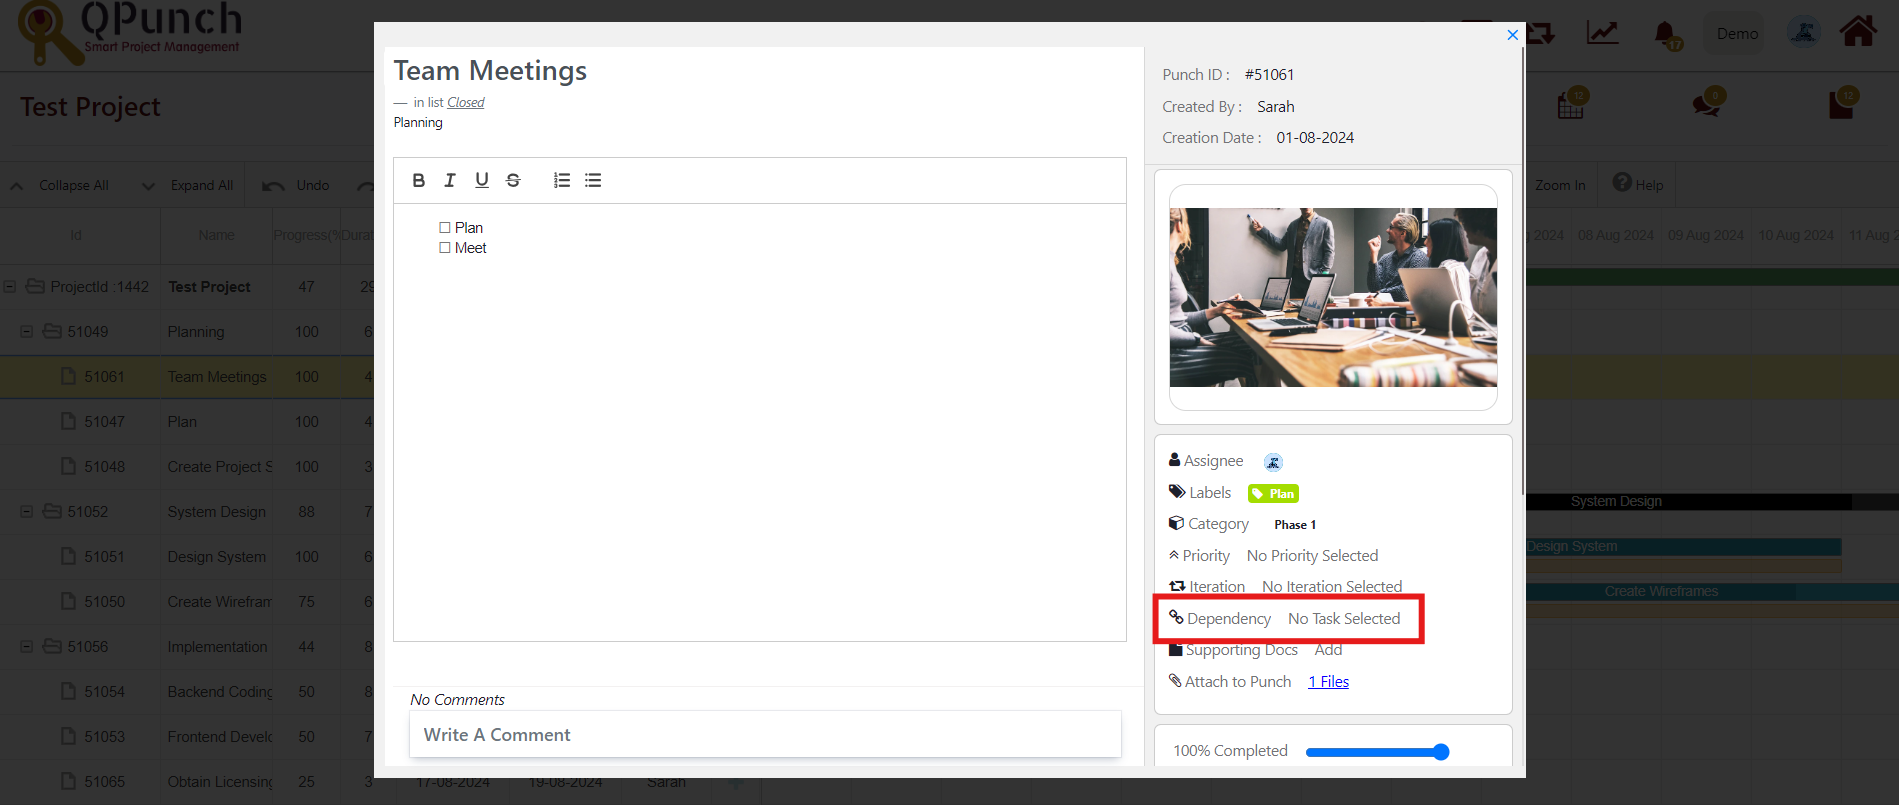
- Navigate to the edit task page to see the dependency

- Click Dependency from the side menu.

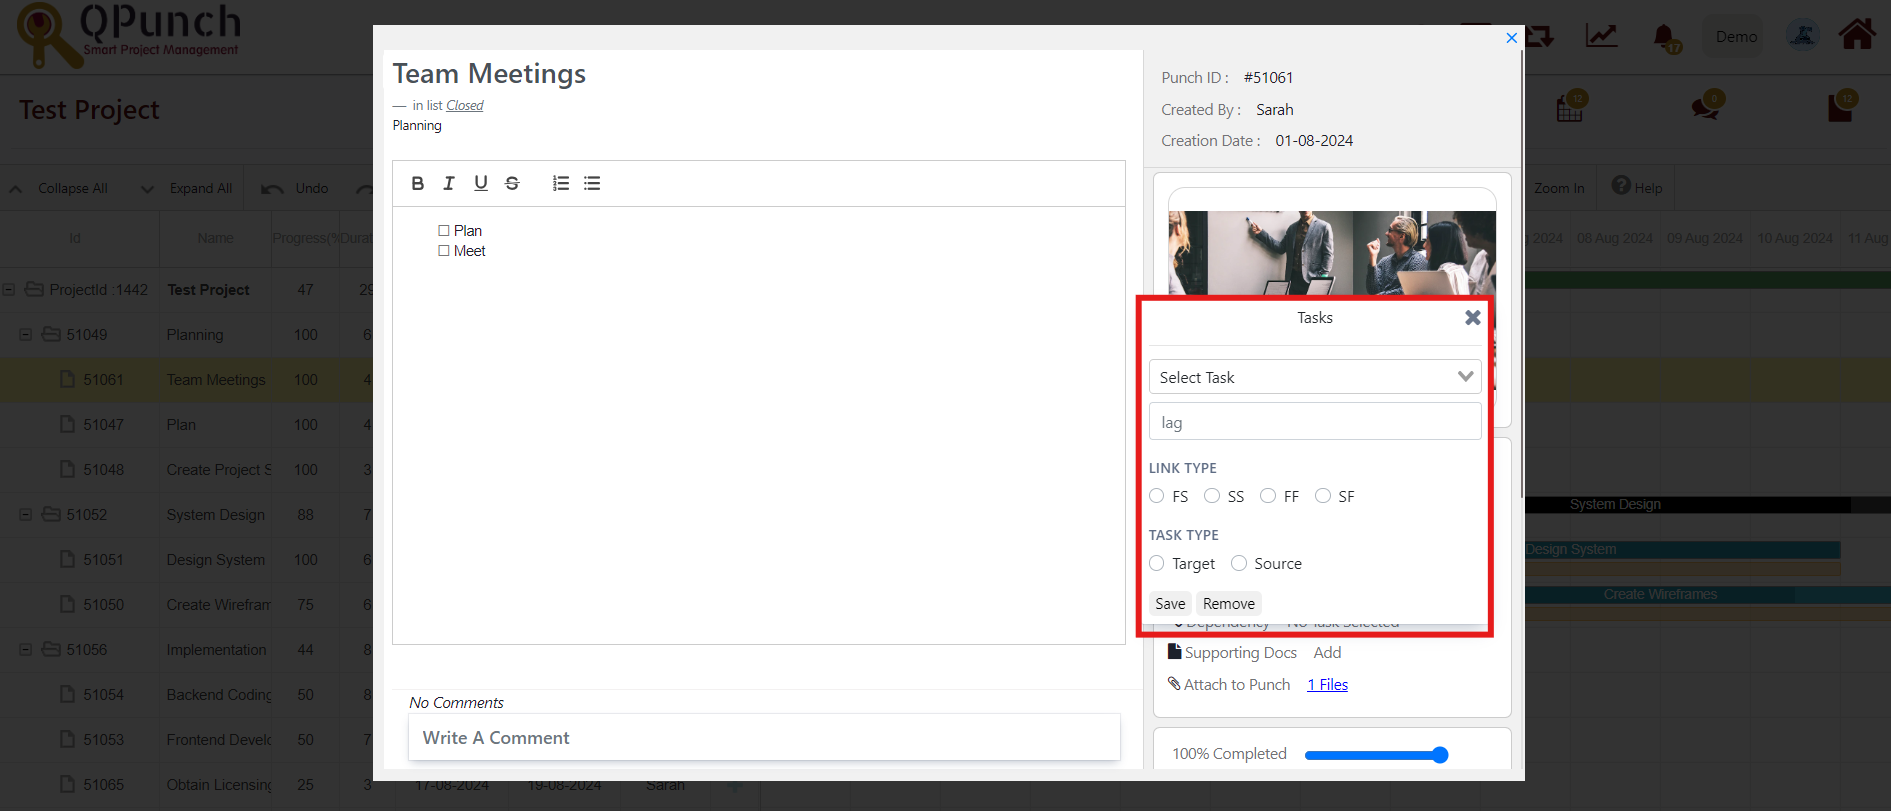
- Click the drop down to select the dependent task.
- If you need to delay a start/finish or begin it early, you can configure a lead/lag time for dependencies. When building dependencies between items, typically one item is set to start or finish the moment another starts or finishes. However, there may be situations where you need to build in a lead or lag time between dependencies. For example, you may need the second item to start shortly before the first item finishes (lead), or you may want to wait a few days after one item finishes before starting the next (lag).
To create a lead or lag time for a specific dependency, click the dependency link in the Gantt chart to open the Dependency Details panel. Then edit the Lead/Lag field:
- To set a lead time, input a negative number.
- To set a lag time, input a positive number.
- Link type
Gantt chart supports the following type of dependencies:
- Finish to Start (FS) – the second item’s start is dependent upon the first item’s finish
- Start to Start (SS) – the second item’s start is dependent upon the first item’s start
- Finish to Finish (FF) – the second item’s finish is dependent upon the first item’s finish
- Start to Finish (SF) – the second item’s finish is dependent upon the first item’s start
By default, the dependency transition happens immediately. For example, in an FS dependency, the second item starts as soon as the first item finishes
- Task Type
We can set the task selected in the dropdown as either target or source to the task edited.
- Select save to apply the dependency or select remove to cancel the dependency.
6. Critical Path:

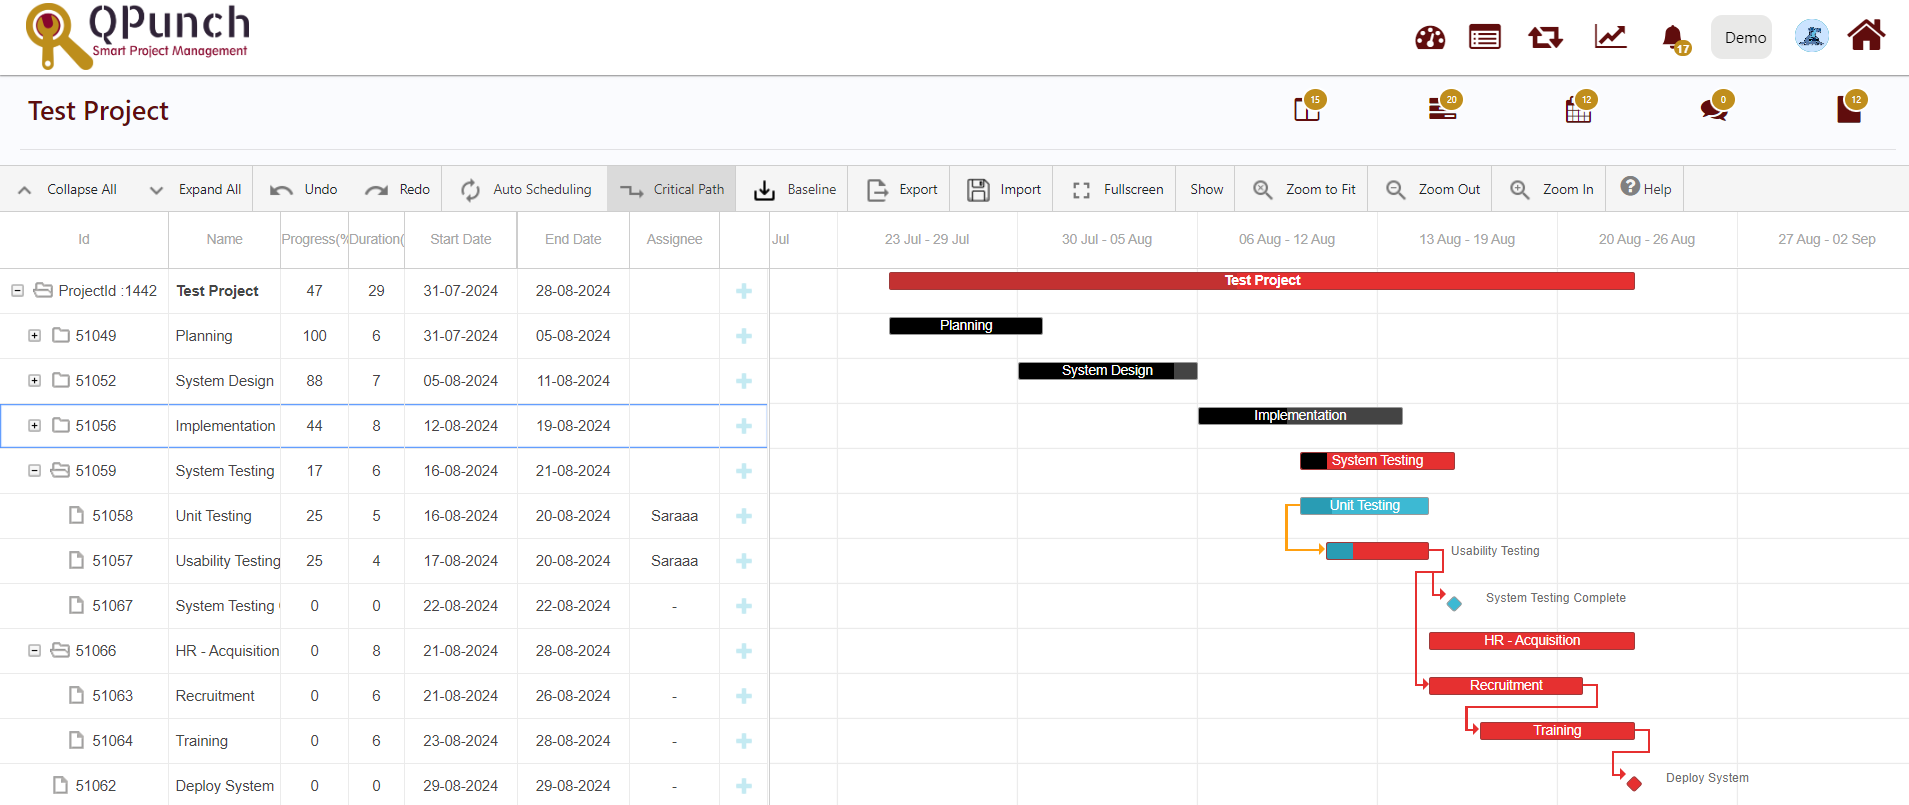
Every task is important, but only some of them are critical. The critical path is a chain of linked tasks that directly affects the project finish date. If any task on the critical path is late, the whole project is late.
The critical path is a series of tasks (or sometimes only a single task) that controls the calculated start or finish date of the project. The tasks that make up the critical path are typically interrelated by task dependencies. There are likely to be many such networks of tasks throughout your project plan. When the last task in the critical path is complete, the project is also complete.

The critical path shows up in red.
7. Baseline:

Baselines used to compare your original timeline projections with the actual timeline of the project. This will help you determine which tasks performed on time or ahead of schedule and which ones got delayed.
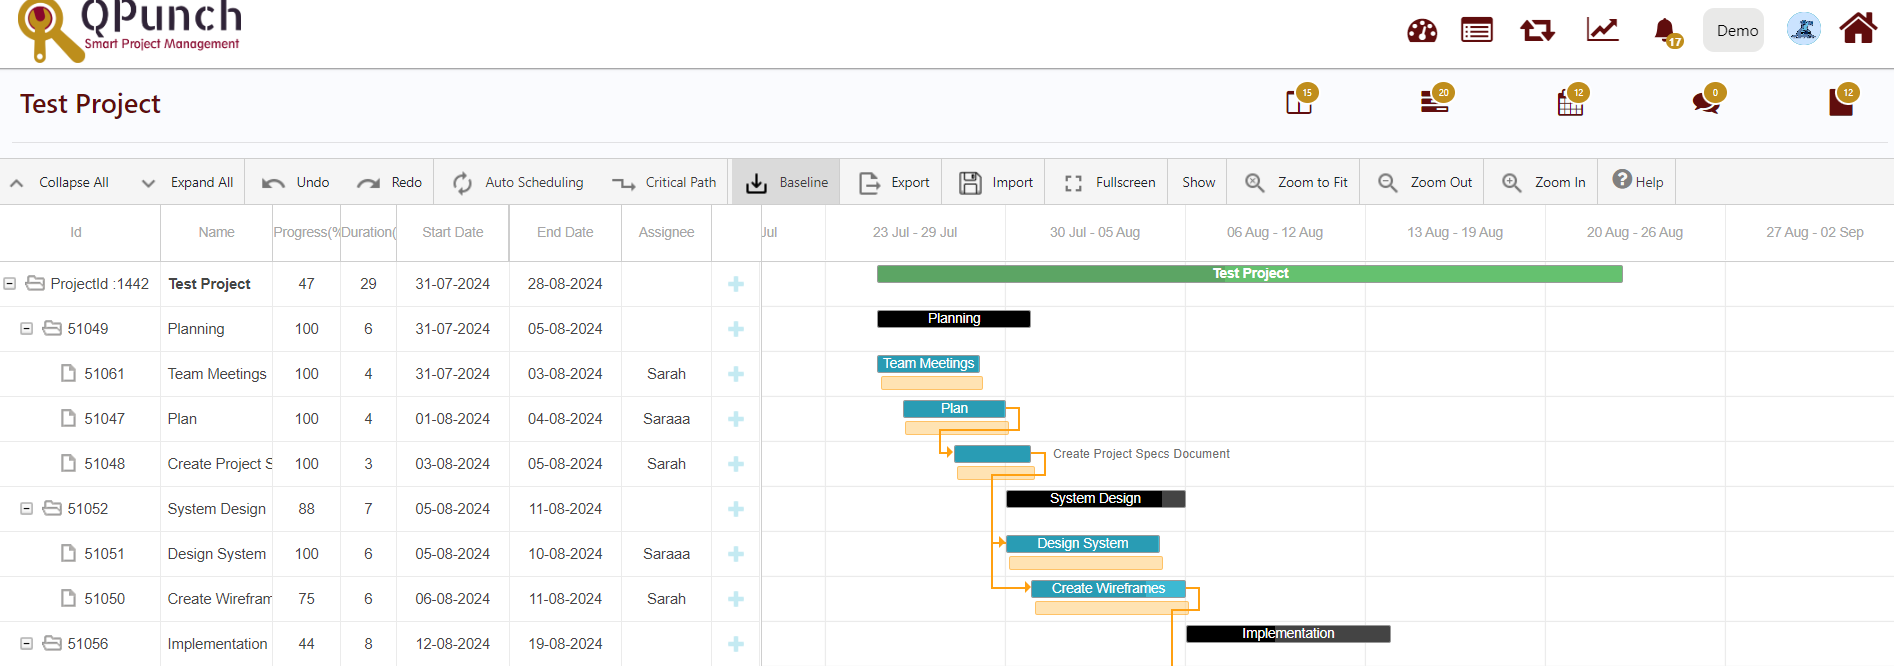
When you click Baseline tab a drop down appears with 3 options.

- Add Baseline:
When u click Add Baseline it will create a baseline for every task. It will appear as a yellow task bar. Since the baseline is based on the current task positions, the baseline bars will be in the same location as the current task. As you adjust the chart, the baselines will remain in these locations, even as the current task bars change.

- Update Baseline:
If you adjust the current task bar position and click Update Baseline, then the baseline will be also adjusted to the same location as the current task.
- Remove Baseline:
It will remove the baseline from the current task.
8.Export:
It is possible to export a Gantt chart into a PDF/PNG/Excel/MS project/PrimaveraP6/ICal file to view offline, print or share with someone else.

Certain parameters of your Gantt chart export are based on the layout of the structure and chart on your screen, including the hierarchy level and zoom level. You should select the desired hierarchy and zoom levels before exporting your Gantt chart.
To configure hierarchy level, you may expand or collapse items manually. To configure the chart’s zoom level, use the Gantt chart zoom toolbar buttons. You can zoom in, zoom out or select a specific unit for your time scale. Once you have set the desired hierarchy and zoom levels, click Export and download your export file.
9.Full Screen:
You can enable Full Screen mode by clicking the Fullscreen tab from the toolbar.

Address On Maps
Ready To Get Started with Smart Project Management?
