The Team Utilization Dashboard is a key feature in QPunch that allows project managers or team managers to analyze their team’s utilization. This dashboard provides insights into the team’s available capacity, planned hours, and work distribution over a selected period.
Team Utilization Dashboard provides a clear and detailed overview of resource utilization, which can be used to efficiently track and optimize their team’s productivity.
Accessing the Team Utilization Dashboard
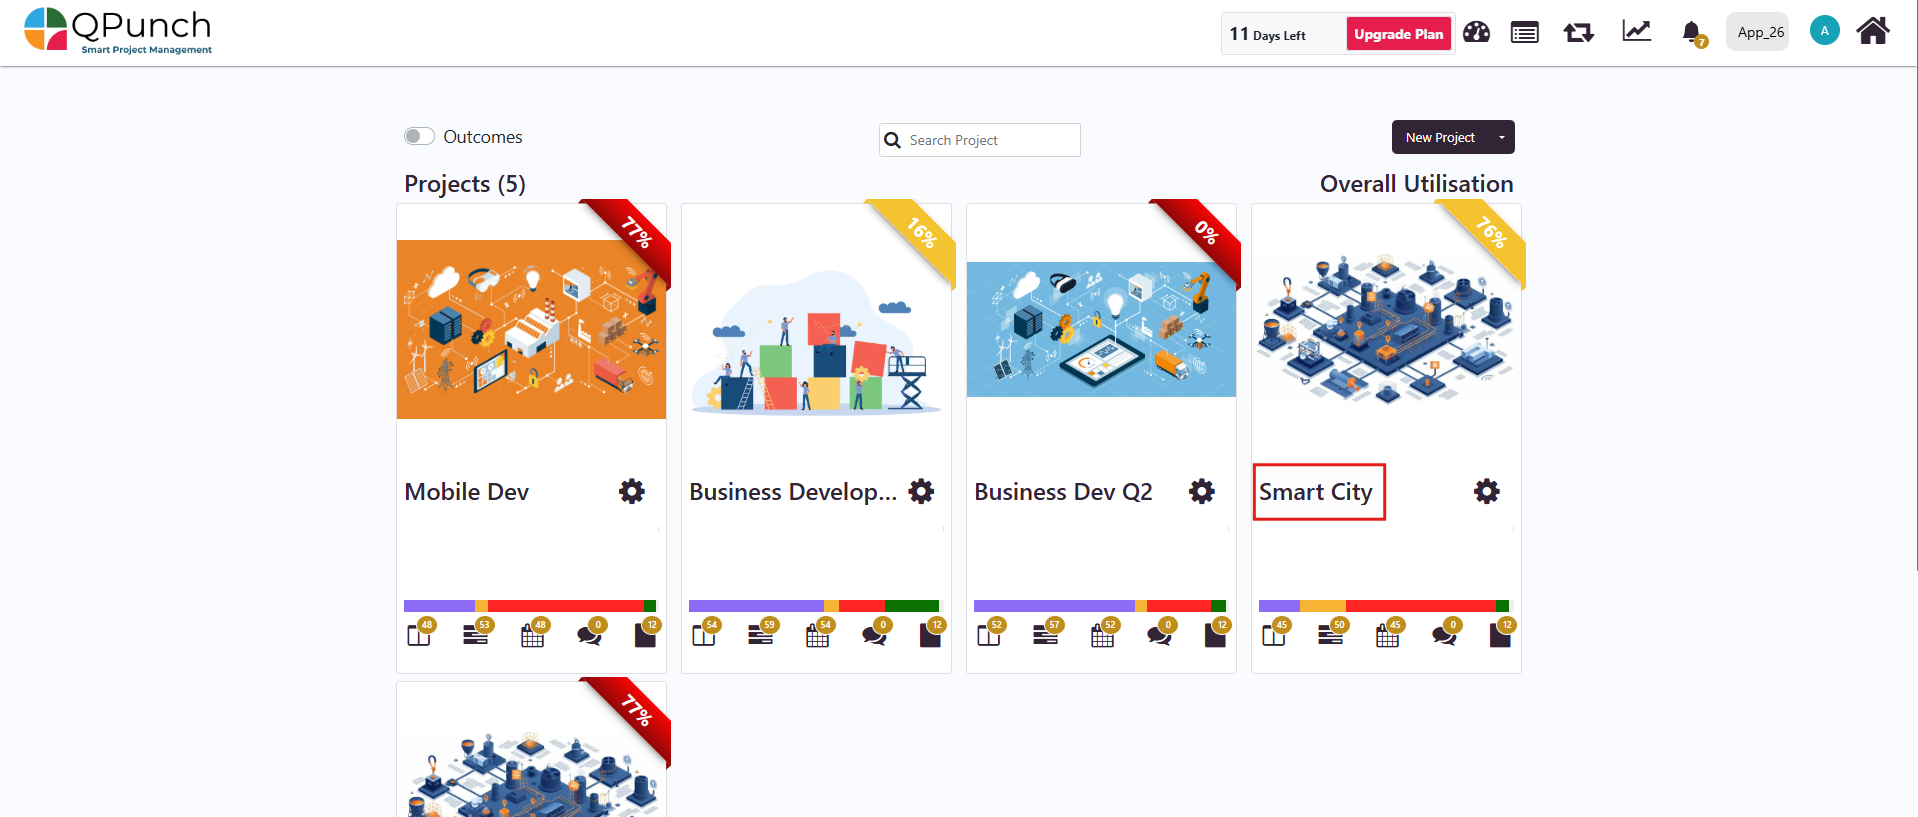
Step 1: From the home page, click on the project name you wish to access
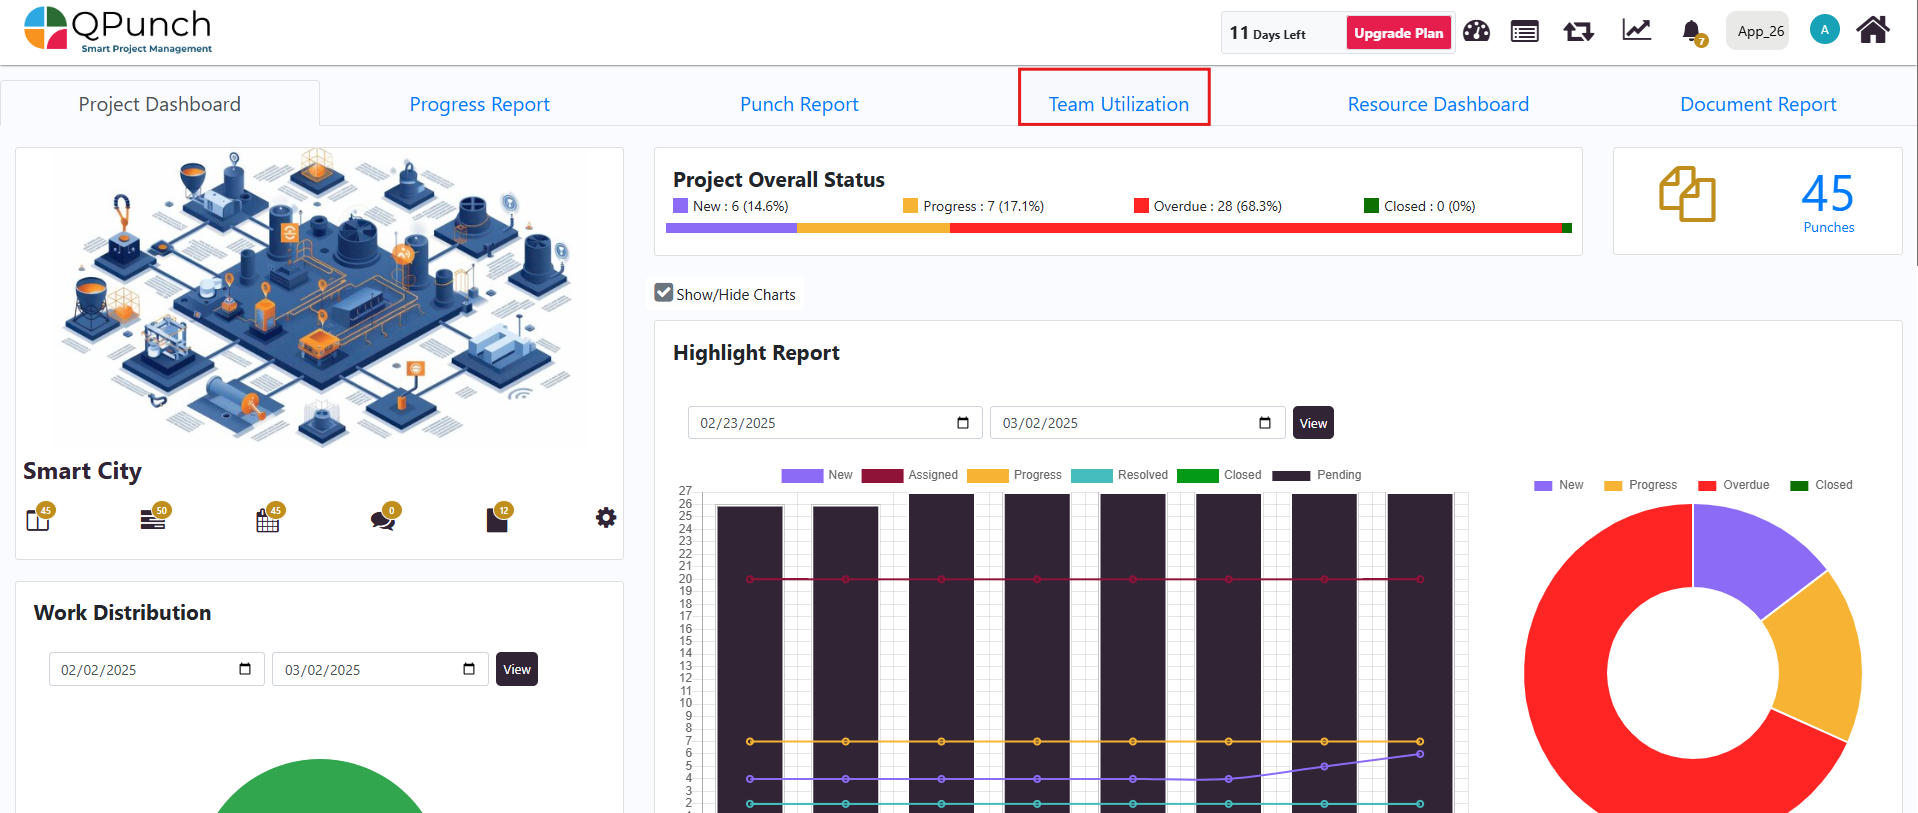
Step 2: Once inside the project dashboard, click on the Team Utilization tab.
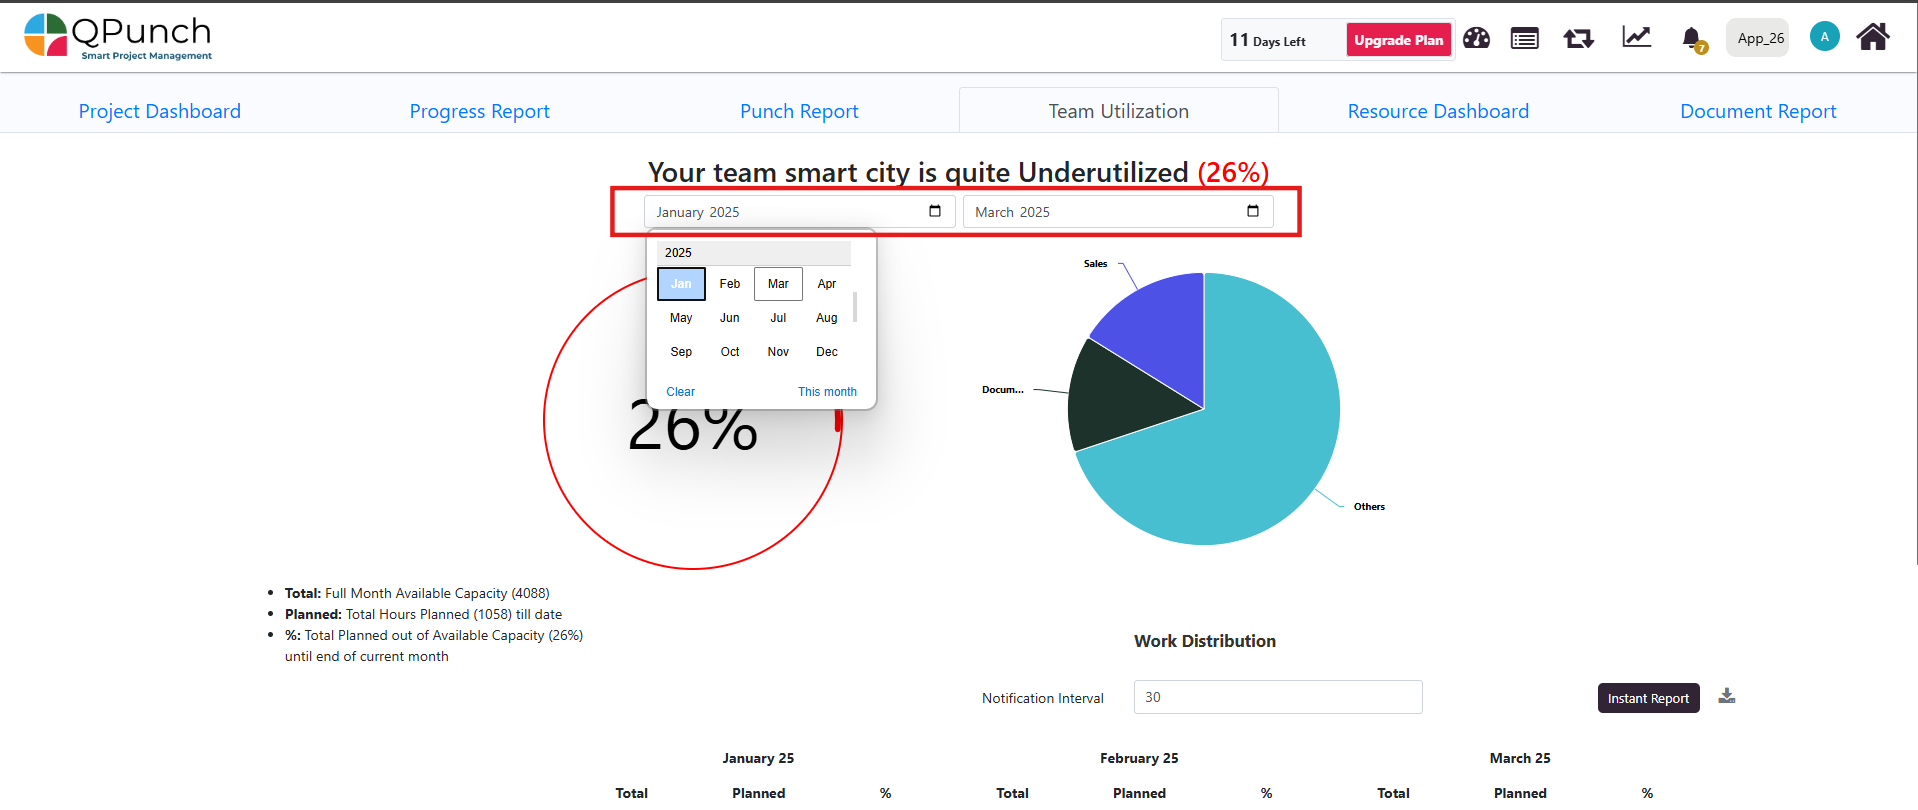
Step 3: You can edit the start and end dates of the Team Utilization Dashboard directly in the Team Utilization tab to reflect the desired reporting period.
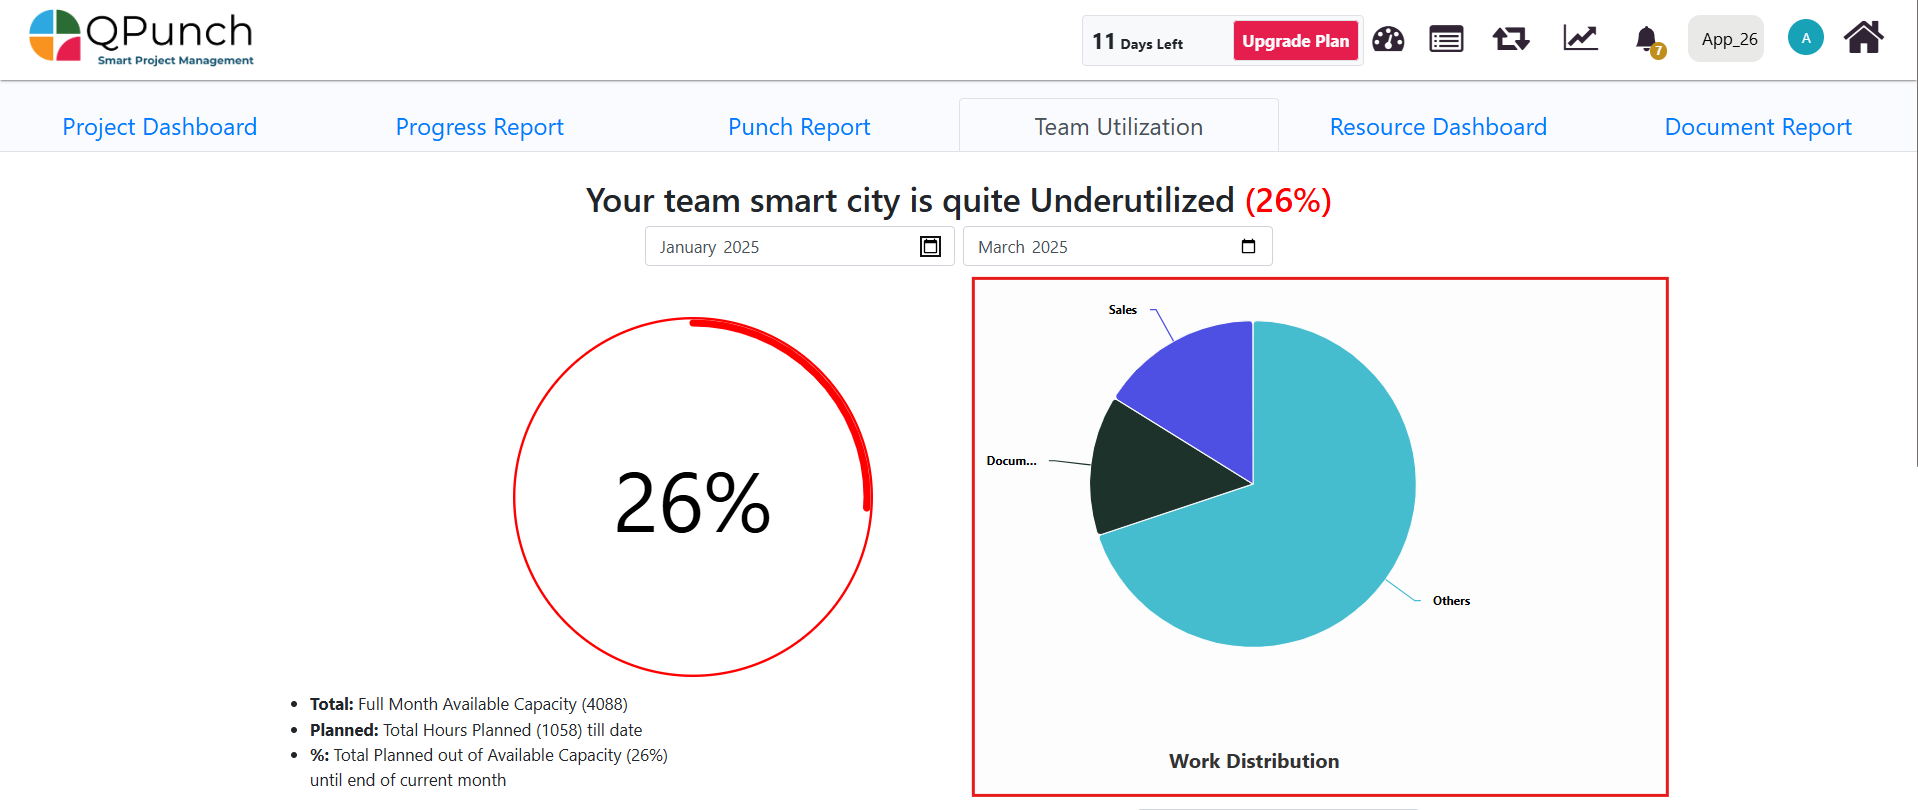
Step 4: Once the duration is selected, the dashboard displays key metrics:
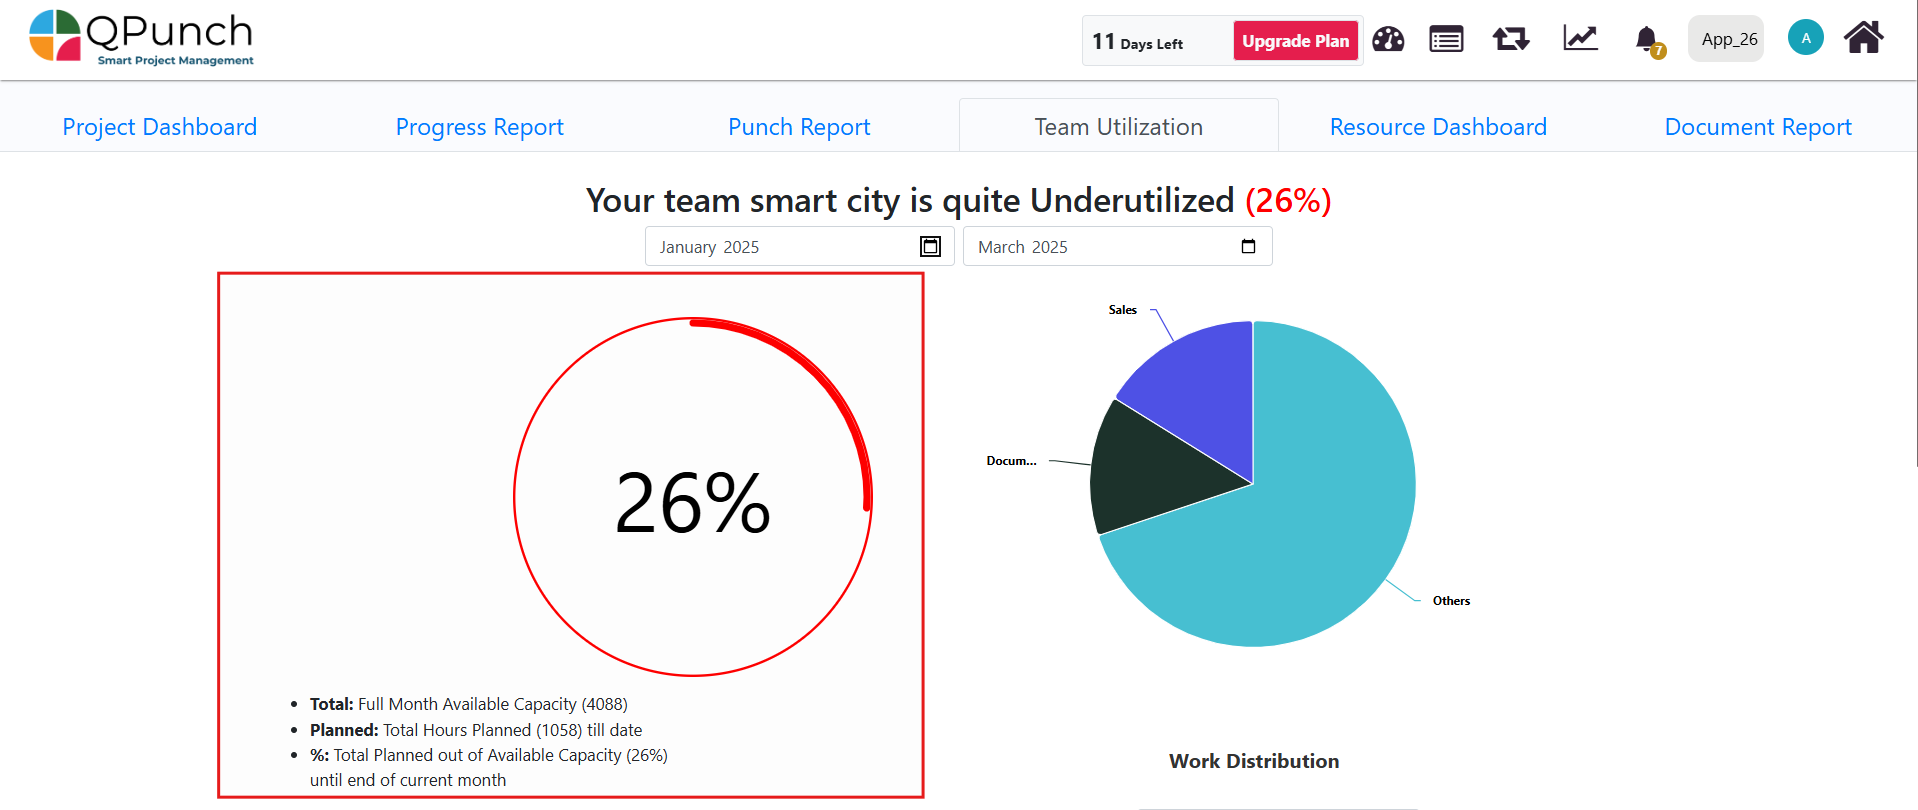
Team Utilization Percentage
Displays the total available hours and planned hours for all team members for tasks until the current date.
Work Distribution Pie Chart
This pie chart represents the breakdown of work in different work areas or different task types: Documentation, Sales, Marketing and other departments.
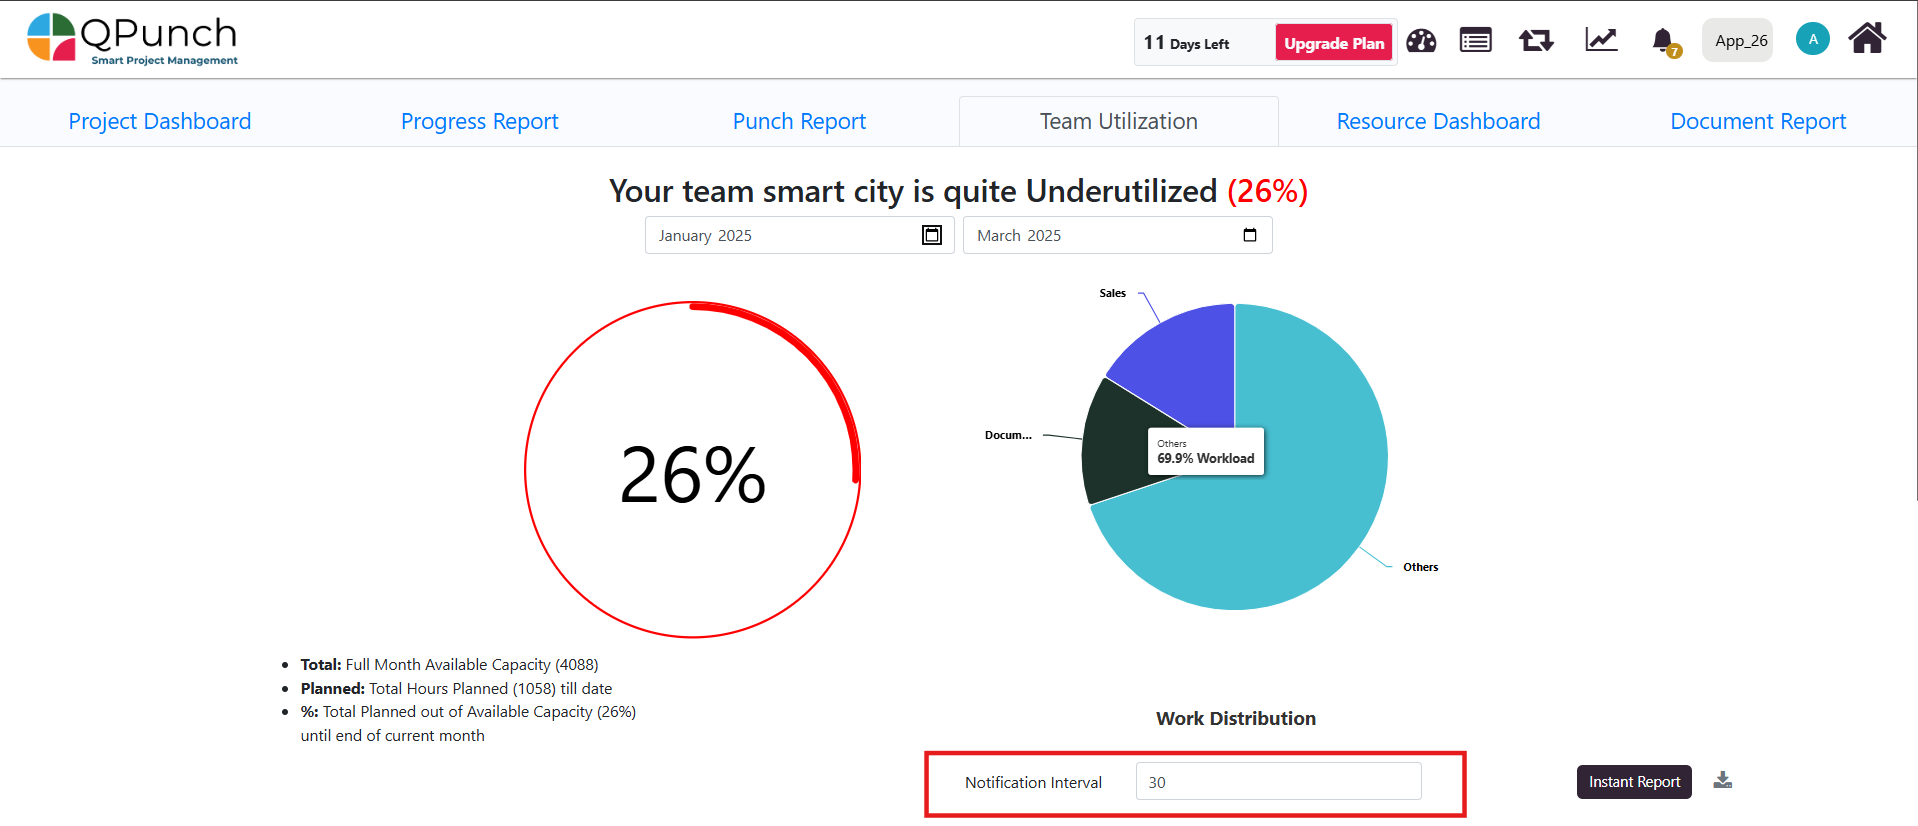
Step 5: Notification Interval & Instant Report.
Notification Interval: You can set how often the Team Utilization Report is sent to the project manager via email. This ensures regular updates on team utilization.
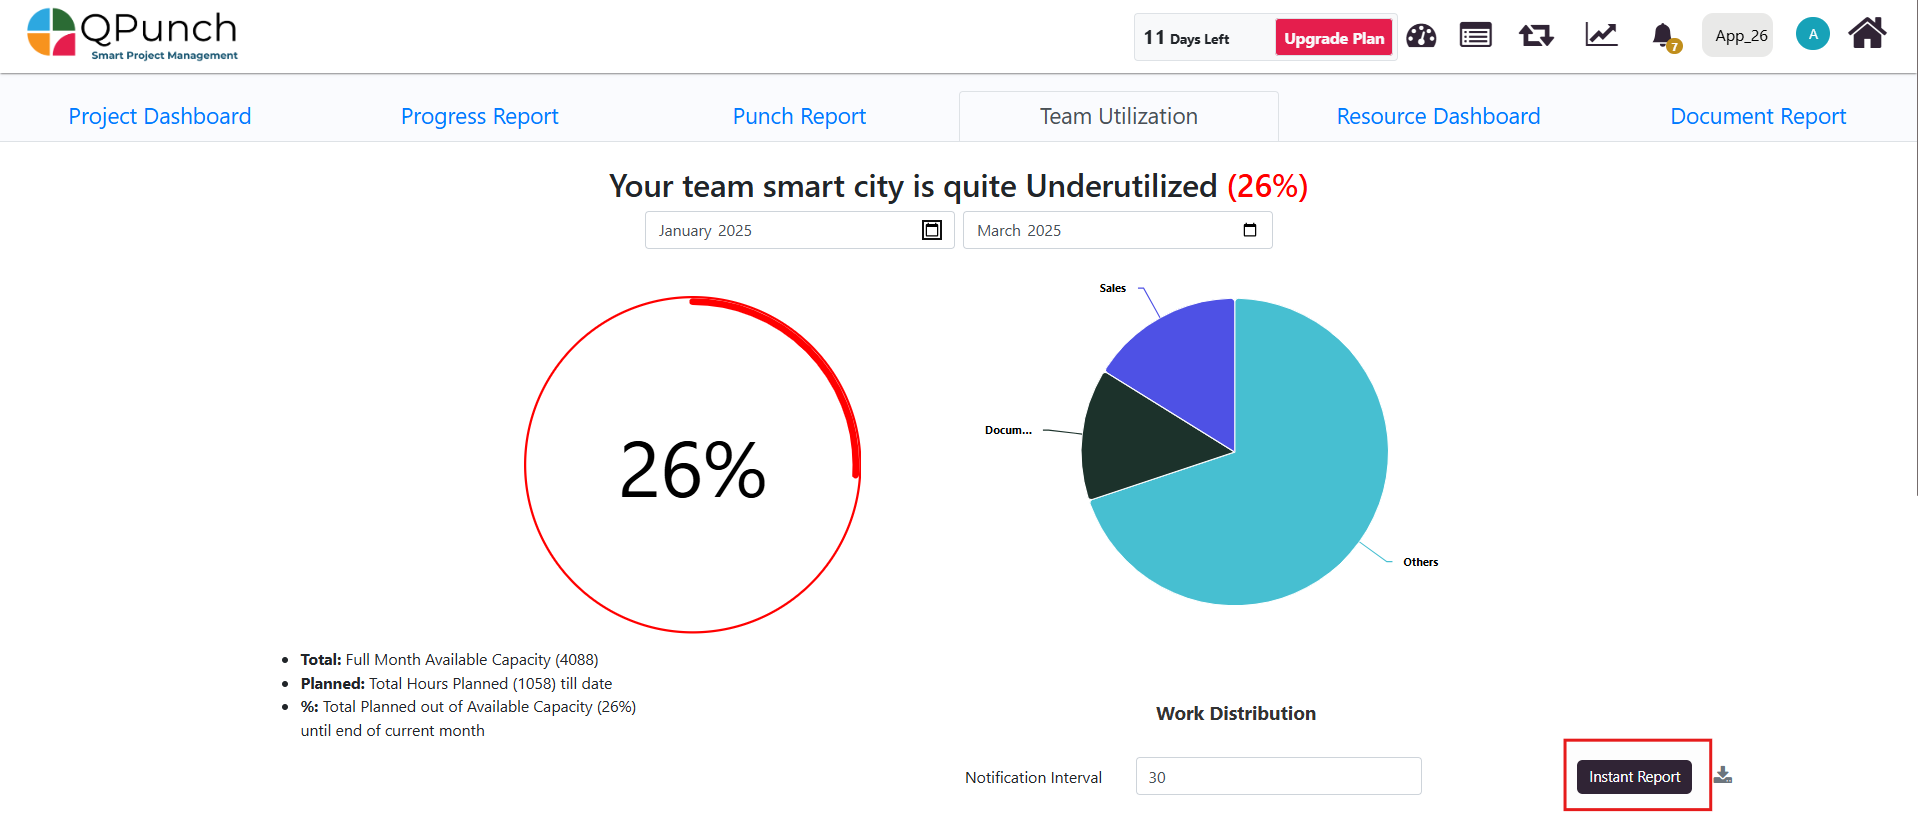
Instant Report: If needed, the manager can generate an instant report by clicking the Instant Report Icon, which will send the latest utilization data via email immediately.
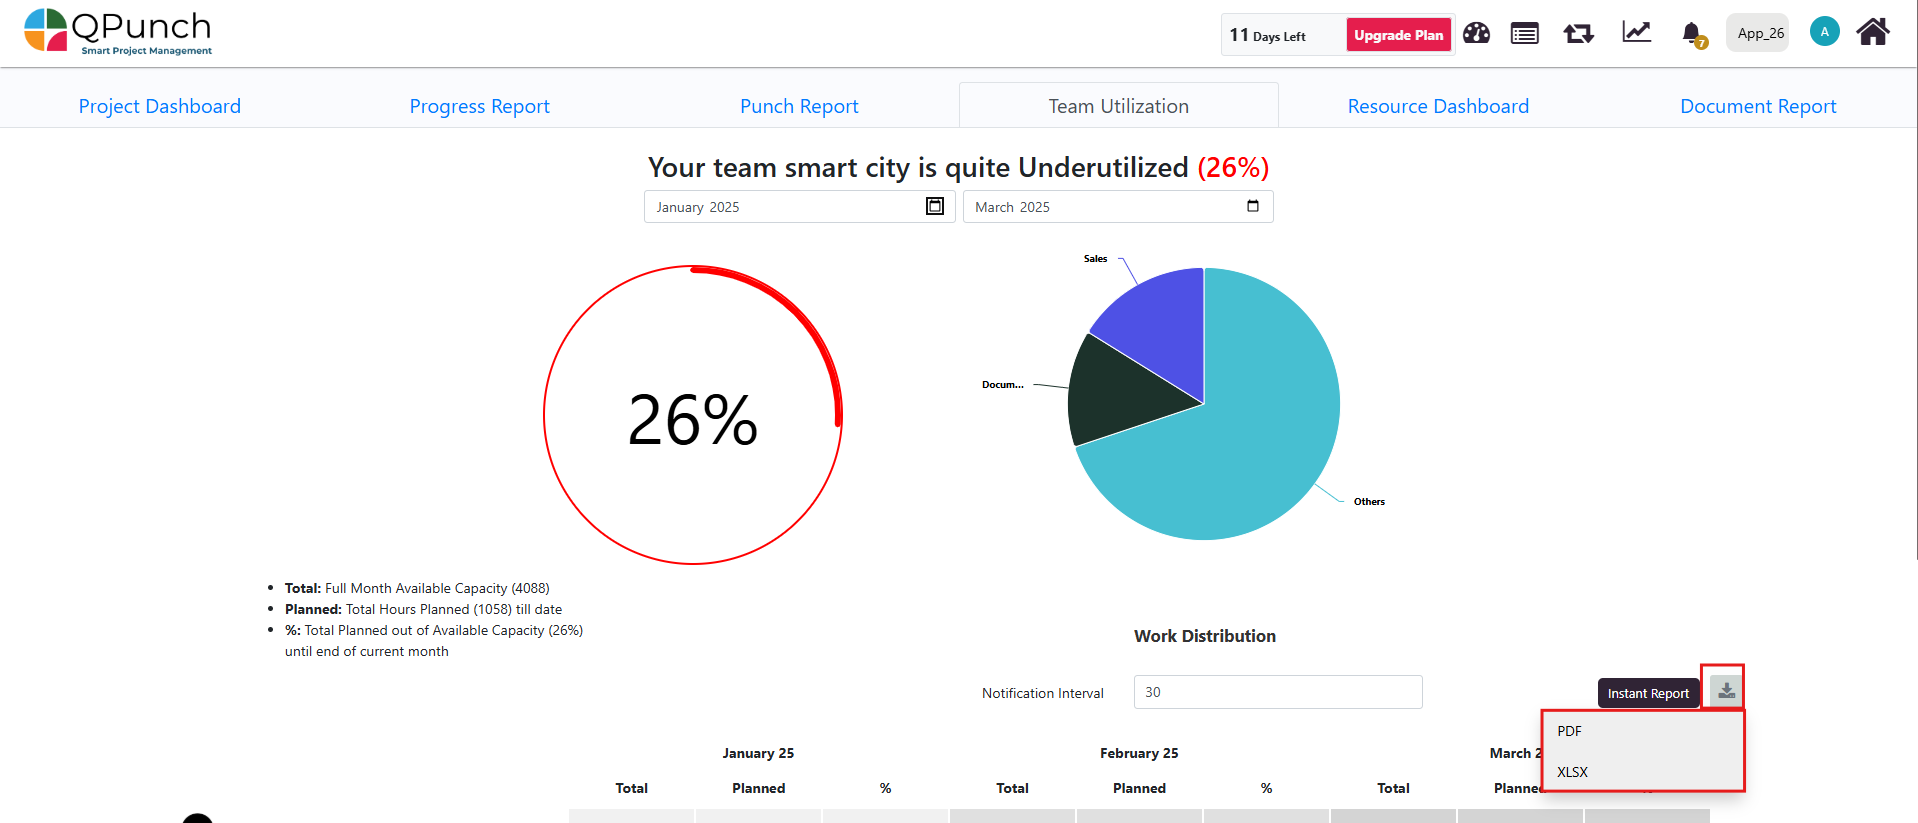
Step 6: Downloading the Report
The Team utilization report can be downloaded in PDF or Excel format by clicking the Download Icon.
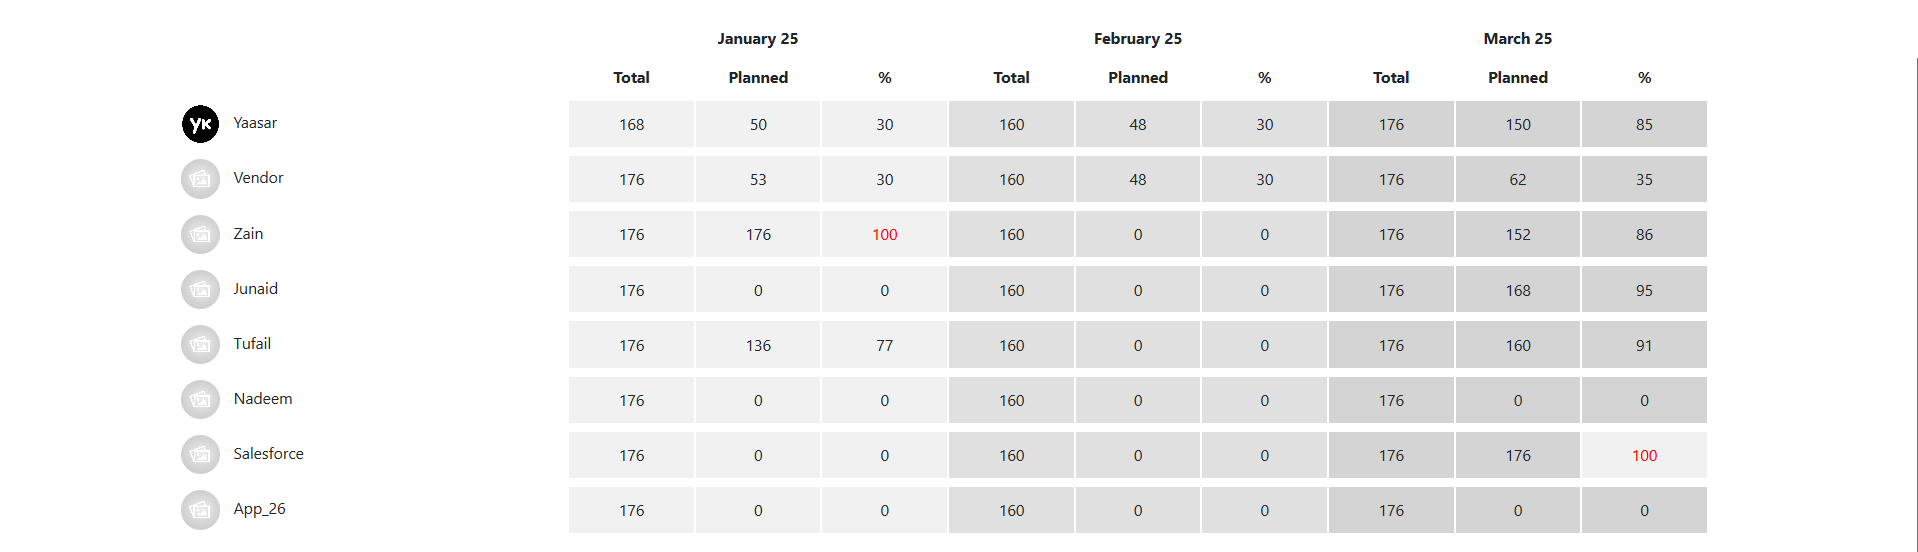
Step 7: Team Utilization Table
Below the pie chart, a detailed Team Utilization Report is displayed in a tabular format. Which shows the total and planned hours of the users with percentage of how much time has been utilized and assigned to the user.
Conclusion: The Team Utilization Dashboard in QPunch helps managers track and optimize resource usage by analyzing planned vs. available hours, workload distribution, and utilization trends, so they can ensure efficient task allocation and improve overall team productivity.